
At the end of the construction of the Eiffel Tower a meteorological laboratory was installed at its summit, the interest being great to know if the observations made on the ground were in conformity with those taken at 300m of height. The results were not surprising, but interesting because they confirmed the knowledge of the time. The rest of this text is taken from the book "The Tower 300m", Gustave Eiffel, which itself takes the annals of the Central Bureau meteorological data for this data of 1889 and 1890, the first two years of observations. This annals will be completed by another, longer, ranging from 1890 to 1894.
Atmospheric pressure
Atmospheric pressure observations were made regularly at the Meteorological Office at an altitude of 33.40 m in a room on the ground floor and on the Eiffel Tower at an altitude of 312.90 m. in one of the rooms that are above the third platform.
"The difference in altitude of the two instruments is 279,50 m, and their horizontal distance of about 480 m. In both stations, mercury Richard log barometers were used, multiplying by two the variations of the pressure; the progress of these recorders is controlled by direct observations, made three times a day at the Bureau and four or five times a week, sometimes even more in the summer, at the Eiffel Tower, with two wide-cup mercury barometers, compared directly with the one to another. All observations were reduced to zero and corrected for instrumental error; reduced heights at sea level are, in addition, reduced to normal gravity, that is, expressed in mercury columns whose density is assessed at sea level and latitude of 45 degrees."
Diurnal and annual changes in pressure. We will not enter into the details of these variations, which involve a very delicate analysis of figures differing only a hundredths of a millimeter from each other, and which have been carefully and extensively studied in Mr. Angot's memoirs. We will only give his conclusions.
The diurnal variation, by the hourly distribution of its maxima and minima, is very different at 300 m of height which is near the ground; it is very close to what is observed at the top of the mountains. The first results of 1889 were clearly confirmed by the observations of the five following years.
As for the annual variation, the average pressure during the six months of 1889 was, for the Meteorological Bureau, 760.67 mm, and for the Tower of 735.58 mm. These pressures brought back to the level of the sea gave for the Meteorological Bureau 763,73 mm and for the Tower 763,64 mm. In the five years that followed, the average true pressures were: for the Bureau, 759.58 mm, and 734.15 mm for the Tower. The average of the reduced pressures are: for the office 762.69 mm, and for the tower 762.57 mm.
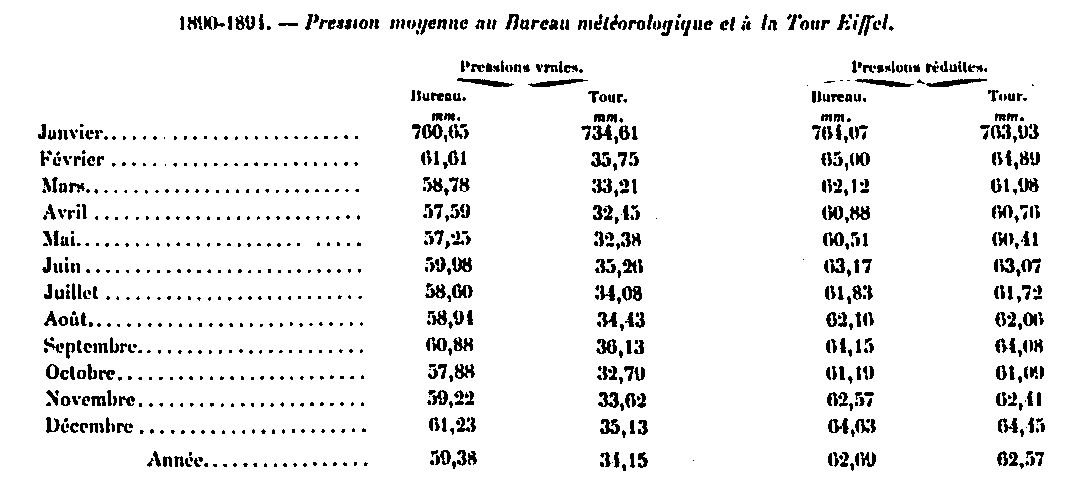
The conclusion is that the pressure observed at the top of the Tower is too low compared to that of the Bureau, not only as an average, but also in every month (see table above). This difference can in no way be attributed to the instruments and corresponds to a real fact. The explanation of this excess pressure, in the immediate vicinity of the ground, is, according to Mr Angot, that because of the high wind speeds at 300 m from the ground, there would exist in this region a mattress of air held by the friction and which is compressed between the ground and the upper layers, animated by a higher speed and freer in their movements.
Accidental variations of the barometer. In general, the movements of the barometer take place in exactly the same way, at close range, at the top of the Eiffel Tower and the Meteorological Bureau; the smallest accidents are found in the same way on the curves of the two recorders. The pressures brought to the same level differ only a few tenths of a millimeter and a maximum of one millimeter in extreme cases, such as the following:
"In November 1889, from the 7th to the 23rd, an area of high pressure, coming from the Bay of Biscay, spread over France and Central Europe; it disappeared towards the south-east of Russia on the 25th, while the low pressures reached north-west of Europe since the 24th; a very heavy squall (735 mm) had its center on the morning of 25 in the south-west of Norway and lowered the barometer in Paris to 752.8 mm. Towards the end of this period, on the 21st, while the wind was nil or weak from the southeast at ground level, it began to blow at the top of the South-Southwest Eiffel Tower from 6 am evening, and there was a remarkable temperature inversion between the summit and the base, which lasted more than two days, until the 24th at 7 o'clock in the morning, and on which we will return later. Meanwhile, the comparison of the pressures actually observed at the top of the Tower with those that can be calculated by the Laplace formula, based on the observations of the Bureau, gave the following results:
On November 20 and 21, the true pressure of the tower was a little lower (-0.1 mm to -0.2 mm) than the calculated pressure; the difference is accentuated at the time of the inversion of temperature and reaches -0.4 mm on average during the night of the 21st to the 22nd. From the evening of the 22nd until the evening of the 23rd, while the barometer begins to lower slowly, the true pressure of the Tower becomes larger than the calculated pressure; the difference is + 0.2 mm on average. On the 24th, on the contrary, from 9 o'clock in the morning, at the moment when the barometer begins to fall rapidly, the true pressure of the Tower is much lower than the calculated pressure; the difference increases progressively and reaches -1 mm on average on the 25th between 1 am and 6 am, at the moment of the greatest speed of decline of the barometer. The difference diminishes at the moment of the minimum and changes sign as soon as the barometer rises; the average difference is 0.7 mm between noon and 6 pm, while the rise in the barometer is the fastest; it becomes only 0.4 mm from 8 o'clock in the evening."
Meteorological Series
Meteorological Series
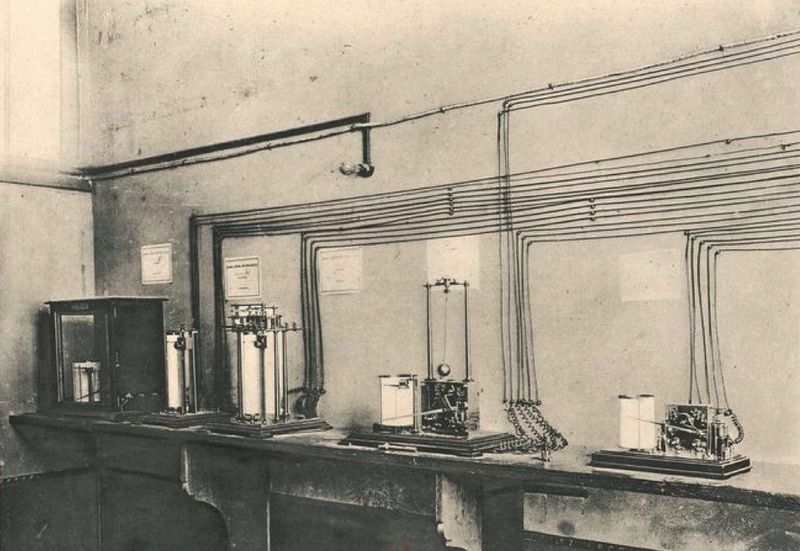
In order: Anemometer, wind vertical measurement, weather vane, anemo-cinematograph, thermometer
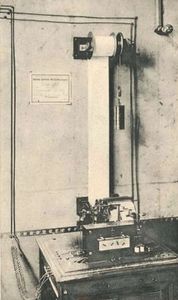
Instant Cinematographer
Instant Cinematographer
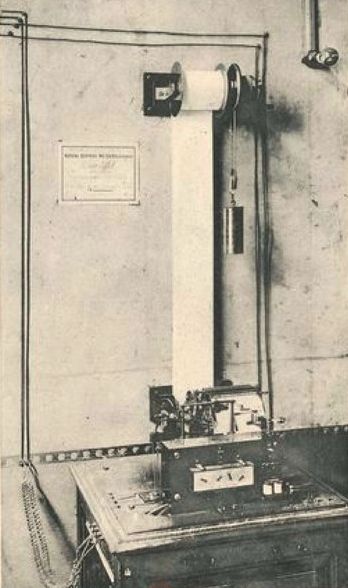
Instant Cinematographer

Barometer Tonnelot
Barometer Tonnelot
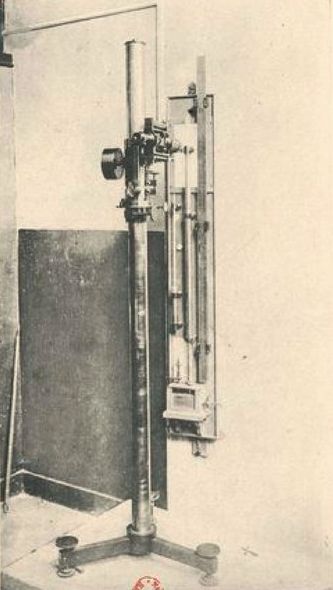
Barometer Tonnelot
Air temperature
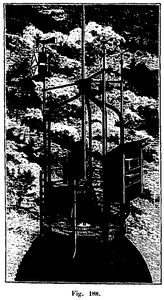
Installation of instruments. A series of temperature observations were made at the Central Office in the courtyard at elevations of 31.6 and 1.60 above ground in a double-roofed iron shed similar to that used in all French stations.
Meteorological platform of the Eiffel Tower in the 19th century
Meteorological platform of the Eiffel Tower in the 19th century
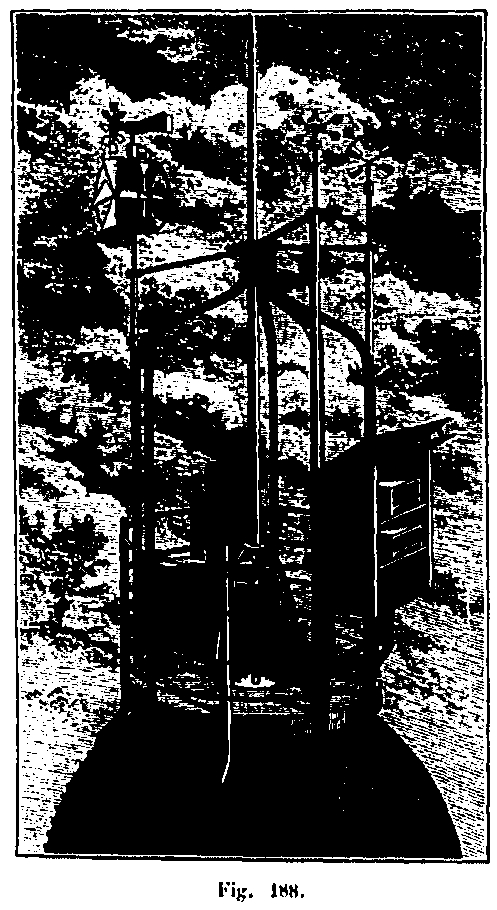
The meteorological platform of the Eiffel Tower as it was at the construction of the tower.
At the Eiffel Tower, the thermometers are placed at an altitude of 335.3 m above sea level and at 301.8 m above ground level, under a double-roofed shelter, hung on the north side, outside the balustrade of the lightning rod platform. The shelter, like that of the terrace of the Central Office, is entirely open to the north and below (see Fig. 188) The shelter is actually much wider than it was indicated on the It is 1 m wide and contains on the same row a psychrometer, the recording thermometer and the maximum and minimum thermometers, and on the lower row are the recording hygrometer and the transmitting thermometer, the north face and the underside, are lined with a very wide mesh metal mesh). It is closed to the East, South and West by two sets of louvers inclined in opposite directions and internally distant about 5 cm. The wind being much stronger at this height than near the ground, the small causes of error introduced by the shelter become negligible, and the observations of temperature can be regarded as made under excellent conditions. Under this shelter are placed a psychrometer. a maximum thermometer, a thermometer at a minimum, a thermometer and a hygrometer Richard recorders; an electric transmitter thermometer of the invention of MM. Richard brothers, who gives the Central Meteorological Bureau the continuous march of the temperature at the top of the Eiffel Tower.
"In addition to these instruments, two other series of direct-reading thermometers and recorders were installed at the Eiffel Tower, one at the intermediate platform (230.20 m above the sea, 196 , 70 m above the ground), the other at the second platform (156.60 m above the sea, and 123.10 m above the ground).
Diurnal variation in temperature. In the following table, we give, for the Central Meteorological Bureau (court) and for the Eiffel Tower, the hourly averages of the temperature in all the months of observation.
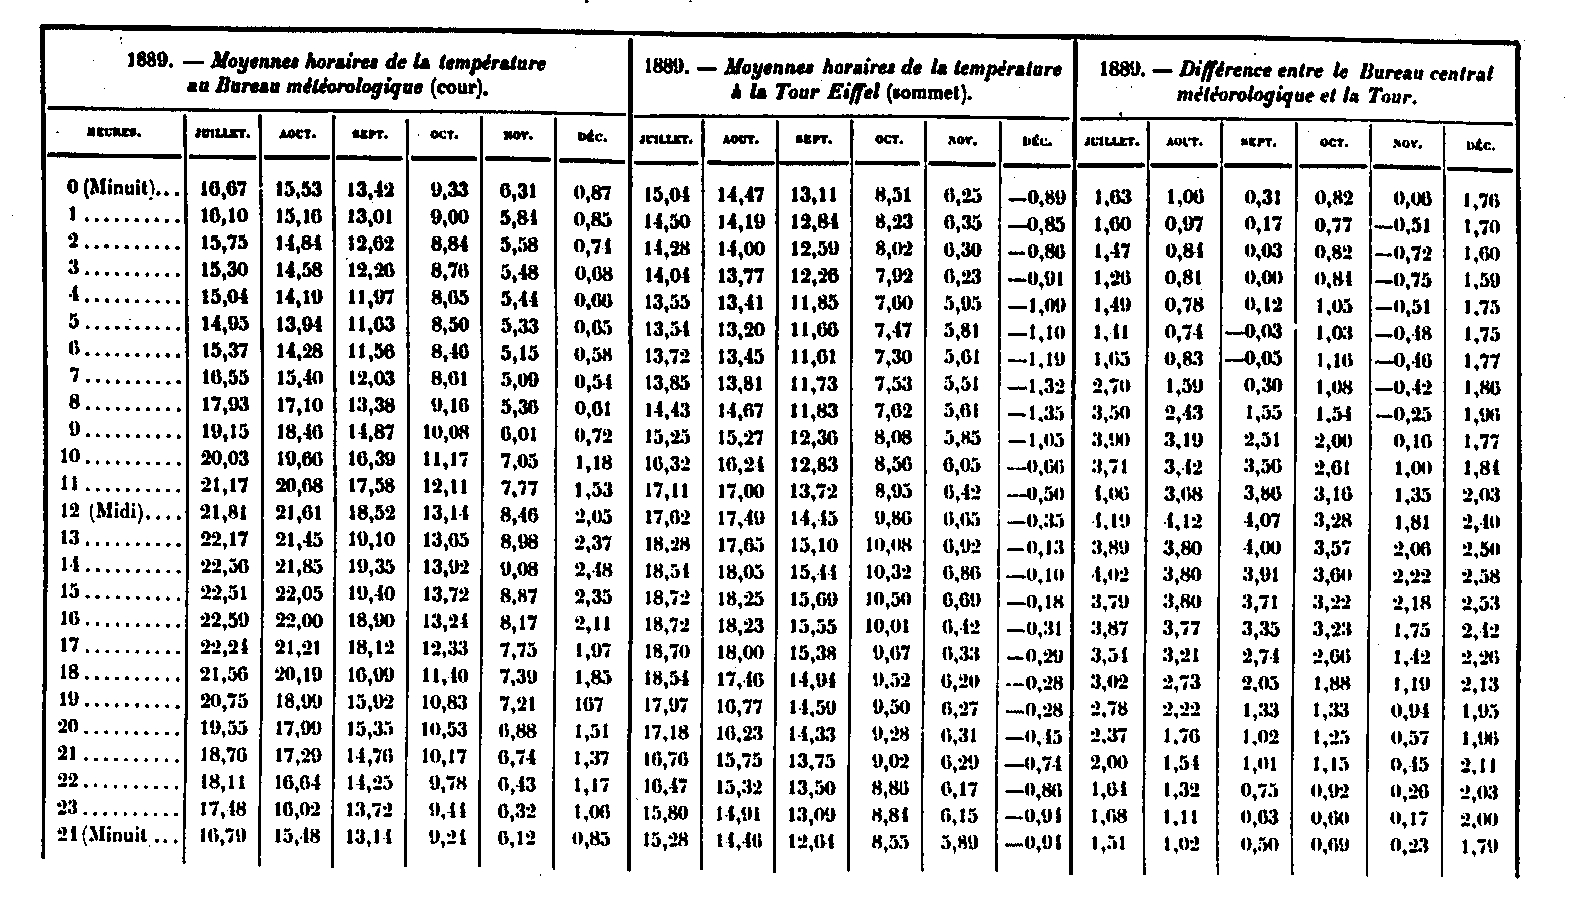
It is interesting to compare the diurnal variations indicated by the preceding table with that of Saint-Maur Park, which represents the normal variation for the Paris region. We give here the result of this comparison. In order not to lengthen needlessly, we are limited to reproducing the differences of time between the Bureau (court) and Saint-Maur, for the six months from July to December; finally, we give for each month the hourly differences between Saint-Maur and the Eiffel Tower.
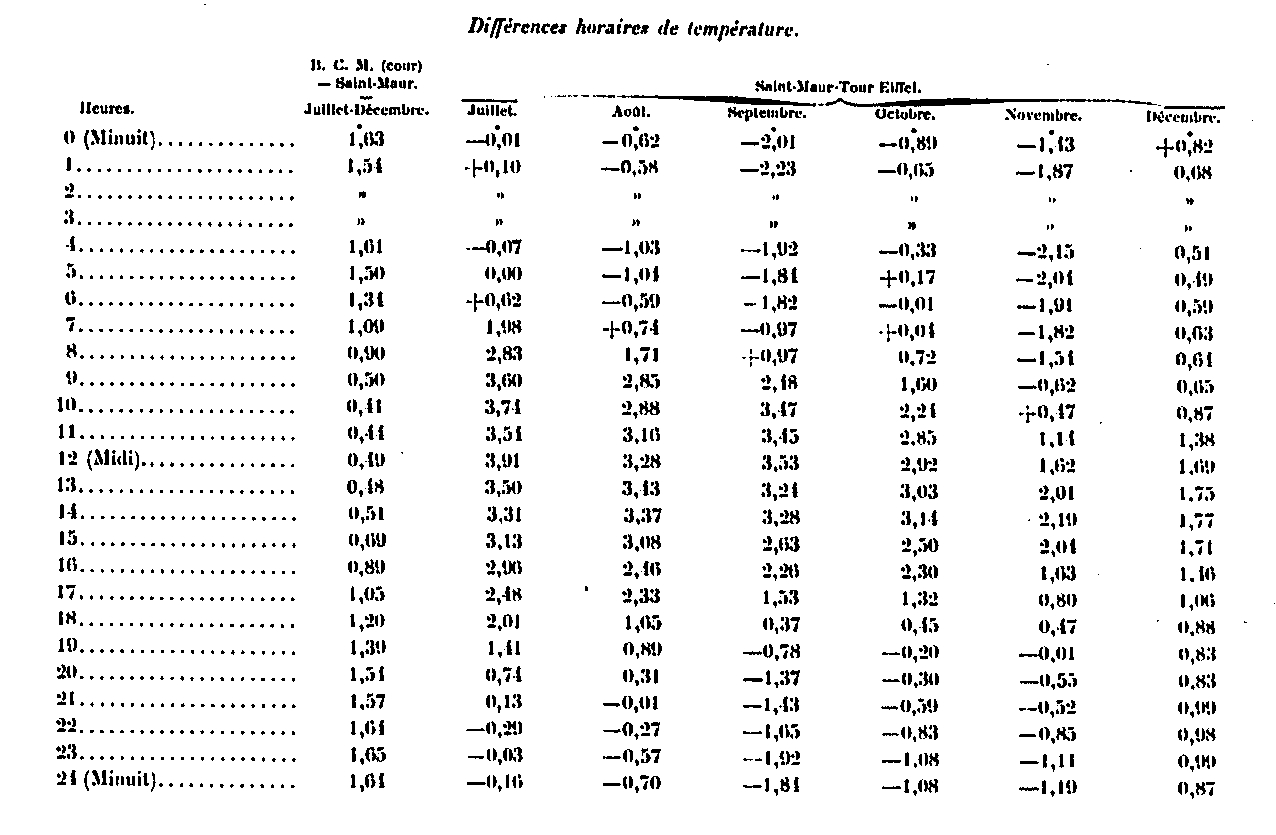
The hourly differences between the Meteorological Office and Saint-Maur are positive; the temperature is thus higher in the interior of the city, in the office, than in the country, as has long been known; but it is interesting to study the hourly march of these differences, which are far from constant.
The excess temperature of the town on the countryside is relatively low in the middle of the day (about 0.4 °), but considerable during the night, when it reaches and exceeds 1.6 °. The influence of the city, at the same time as it raises the average temperature, completely modifies the form of the diurnal variation and diminishes its amplitude. These comparisons, which will be continued, are interesting in that they will make it possible to evaluate in more detail than was usually done the magnitude and nature of the errors to which meteorological observations made in the cities are subject.
As the observations of the Eiffel Tower are, thanks to the very altitude of the station and the strength of the wind that prevails, removed from the disturbing influences of the city, we compared them with those of the Meteorological Bureau. , but to those of Saint-Maur which give the normal values corresponding to the climate of Paris. The difference in altitude of the thermometers in the two stations is 285 m, which, assuming an average decrease of 1 ° for 180 m, should give a normal temperature difference of 1.58 ° between them.
Not only does the temperature at the top of the Tower during the night constantly differ from that of Saint-Maur by less than 1.58 °, but, even for five months out of six (December 1889 is the only exception), the temperature is higher in absolute value at the top of the Tower than in Saint-Maur, and there is inversion of temperature between the ground and 300 m of height. During the day, on the contrary, the difference in temperature is much greater between the two stations than the normal value of 1.58 °.
These differences are easily explained by the role soil plays in the diurnal variation of temperature. The air, which has a very weak absorbency, heats up not very much during the day, and likewise cools little during the night. At a certain height in the free air, the amplitude of the diurnal variation must therefore be very small; it is large in the lower layers only because they warm up and cool in contact with the soil. During the five months of July to November inclusive, the amplitude of the diurnal variation at the top of the Tower was less than 4.5 ° on average than at Parc Saint-Maur. On the mountains, the same effects occur, but in a proportionately less marked than in the Eiffel Tower, because the mass of the mountain still plays a role and produces at the top a diurnal variation much greater than that which the l should be observed normally at the same height in the open air.
The phenomenon of inversion of the temperatures with the height is somehow normal in the clear and calm nights. It is only when the cold is brought by an east wind of noticeable speed that the temperature is lower during the night at the top of the Eiffel Tower than near the ground. An interesting consequence of this difference in diurnal variations is that at a certain height the average temperature must be relatively higher than near the ground. During the day, in fact, the ascending currents make the vertical decay of the temperatures, which is close to adiabatic relaxation, more rapid; during the night, on the contrary, the lower layers cool a great deal, and when the air is calm, the cooling does not communicate appreciably to the higher layers. This last effect is much greater than the opposite action during the day, the upper layers must therefore have, on average, a higher temperature than that which one would calculate starting from the temperature of the layers close to the ground and taking into account count of normal decay. This average excess temperature of the high layers thus comes from the fact that the nocturnal cooling is relatively smaller at the top than is the diurnal heating.
Annual change in temperature. In the following table we give the monthly average temperatures obtained in 1889, at the Meteorological Bureau (courtyard), at the top of the Eiffel Tower and at Parc Saint-Maur. These numbers are the twenty-four hour averages.
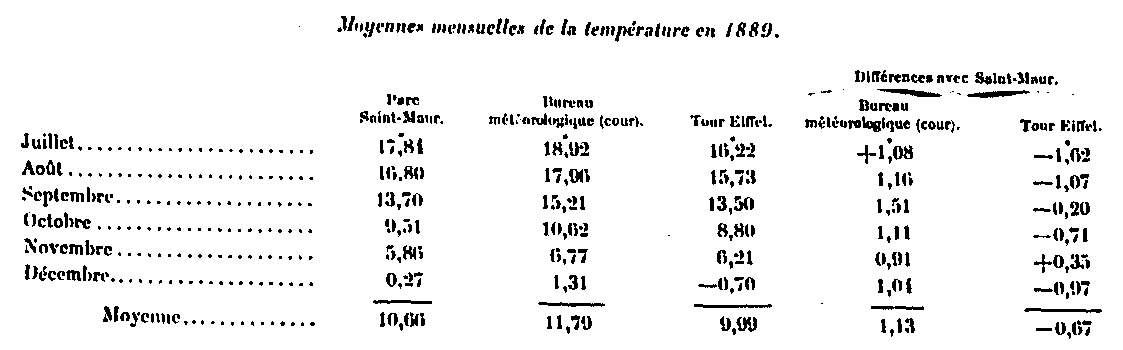
The altitude of the thermometers in Saint-Maur (50 m) and on the terrace of the Central Office (53 m) is essentially the same; the numbers are therefore directly comparable. The Bureau average, in the interior of Paris, is exactly 1.13 ° higher than in the country; but the difference is far from constant in every month.
The duration of the observations on the Eiffel Tower is still too short for us to deduce interesting conclusions about the average decrease in temperature with height. We see however that, except in July, the difference with Saint-Maur was constantly smaller than the value which would correspond to a decrease of 1 ° for 180 m; this is mainly due to the very frequent temperature inversions which occur during the night and whose effect, as we have indicated with regard to diurnal variation, is to give a certain distance from the ground a relatively higher average temperature than in the lowest layers.
One month, the month of November, gave an absolute higher temperature on the Eiffel Tower than in Saint-Maur; this anomaly is due solely to a remarkable period of inversion, which lasted from November 21 to 24, and during which the temperature at 300 m height was constantly much higher than near the ground (the difference even reached 12.8 ° 22, at 5 am); we will come back later on this period. If we subtract from November the three days included from 21 at noon to 24 at noon, we find, as the average temperature of the remaining twenty-seven days, 6.24 ° at Saint-Maur and 5.97 ° at the Tower Eiffel, which makes disappear the indicated anomaly.
Irregular variations in temperature. Irregular variations in temperature occur in much the same way at the Meteorological Office and at Parc Saint-Maur, despite the distance; but it's not the same at the Eiffel Tower. Very often the curves of the Tower and Office recorders show no analogy; in a general way, those of the Tower are less regular: at the same time that the diurnal oscillation decreases in importance, the accidental disturbances are much more marked, and often even there are considerable, which remain absolutely unnoticed below. The observations of the Eiffel Tower are particularly interesting in that they show that the general conditions of the atmosphere at a very low height may differ entirely from what is observed near the ground, where disruptive influences of all kinds slow down. and even completely suppress a large number of movements.
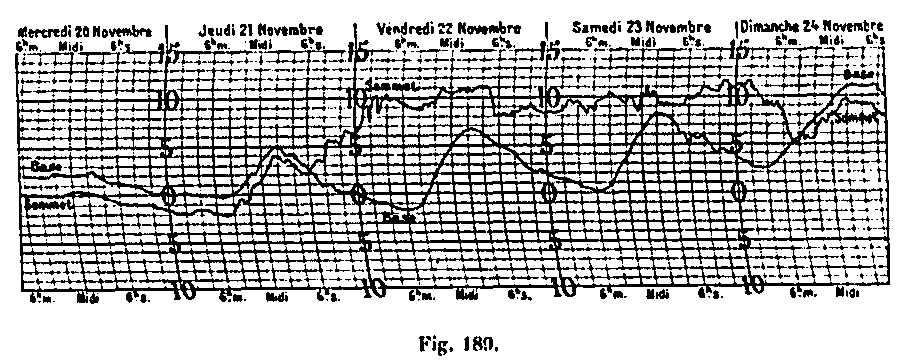
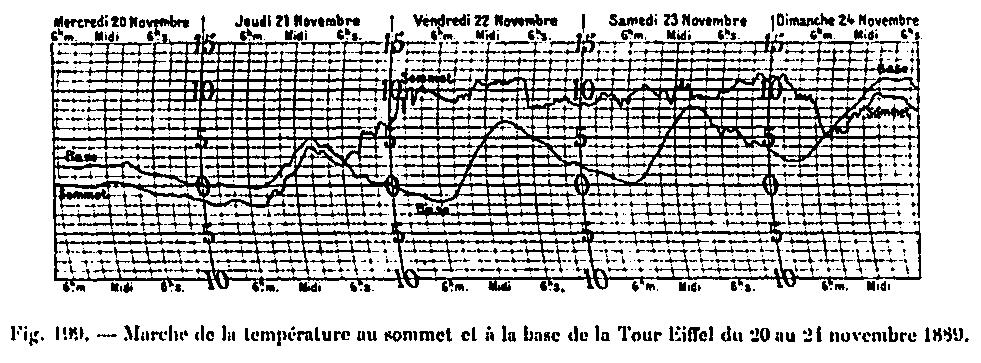
One of the most remarkable examples in this respect has been provided by the period between the 21st and the 24th of November. At the Eiffel Tower, the temperature was usually lower than near the ground on the 21st during the whole day; the wind was weak from the East-North-East with a variable speed of 2 m to 4 m per second, when, from 6 o'clock in the evening, the wind began to gradually incline towards the South; it is south-east full at 7 o'clock in the evening, South at 10 o'clock, and from midnight 10 minutes settles to South-South-West; it then oscillates only between South and South-West until the 24th with a speed between 5 m and 10 m, while below the air was almost constantly calm or one felt only a very weak wind of between South and South-East, whose highest speed did not exceed 2 m. At the same time, the temperature at the Tower, instead of falling on the evening of the 21st, rises sharply from 6 pm and increases by 7.3 ° between 6 pm and 2 am. From this moment until the 24th at 7 o'clock in the morning, when a deep depression arrives by the north of the British Isles and brings to the ground level in Paris the south-west wind regime, the temperature has remained constantly higher on the Eiffel Tower at the base, as seen in Figure 189, which is an exact reduction of the curves of recording thermometers installed at the top of the Eiffel Tower and at the base (East pillar). There was therefore only 300 m of height a complete change of regime which took more than two days to be felt to the ground. What is most remarkable is that nothing could predict from below these conditions; from the evening of the 21st until the morning of the 24th, the sky was constantly of perfect purity.
Due to the interest of this period, we give the details of hourly observations of temperature at the Eiffel Tower and Parc Saint-Maur during the inversion period, from 21 to 4 pm until 24 at 9 o'clock in the morning.
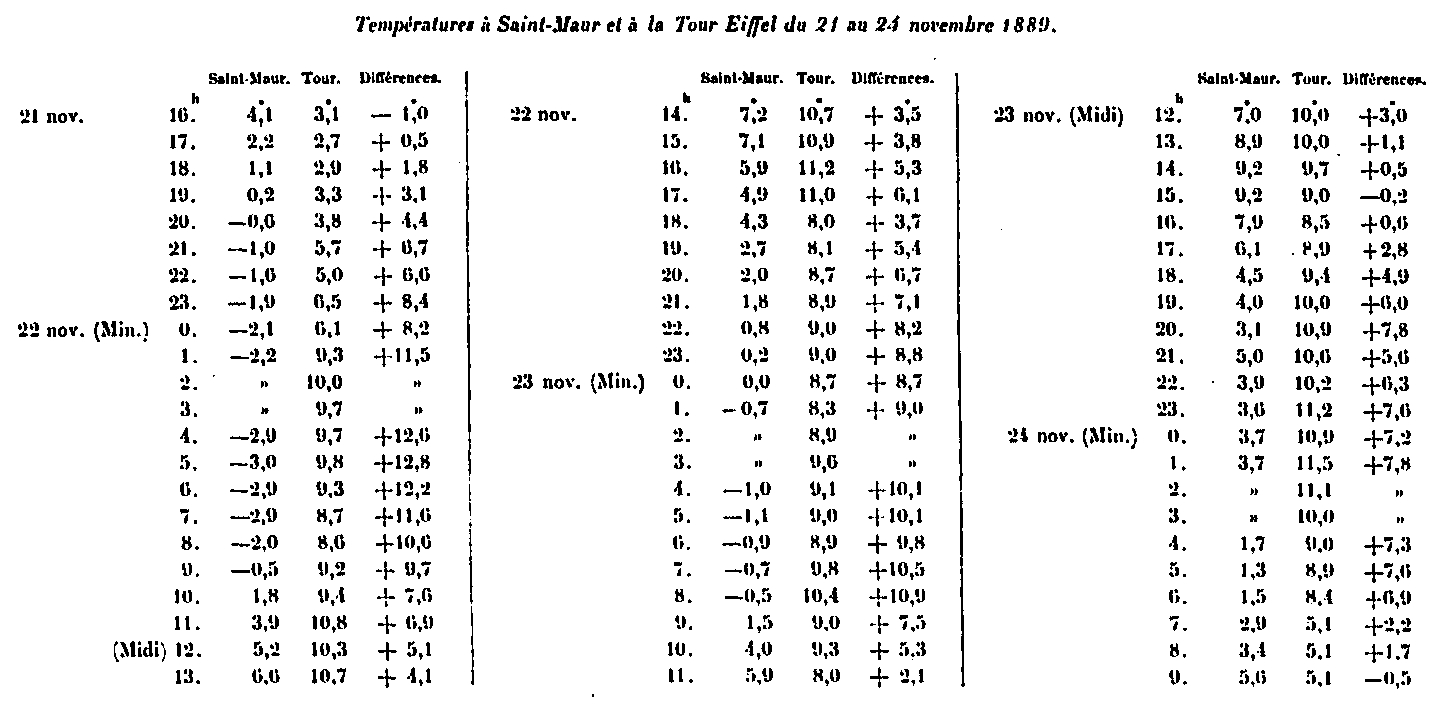
These differences of temperature are all the more remarkable because the diurnal variation of your temperature was very great at the Parc Saint-Maur on the 22nd and 23rd because of the purity of the sky; despite these adverse conditions, the temperature inversion persisted even during the day.
Atmospheric humidity
Device installation. Atmospheric humidity has been recorded at the top of the Eiffel Tower since July 10, 1889, by means of a hair hygrometer of MM. Richard brothers, installed next to the thermometers, is 301.80 m above ground level and 335.30 m above sea level. This instrument is controlled by direct observations made to the psychrometer as often that this is possible.
Diurnal variation in relative humidity. The following table contains, for the last six months of the year 1889, the hourly averages of the relative humidity at the Eiffel Tower; we add as a comparison term the corresponding value for Parc Saint-Maur. As the observations did not begin in the Tower until the afternoon of 9 July, this month's averages include only 22 days, from 10 to 31. Finally, the December averages also include only 22 days. The recorder was stopped from the 15th to the 10th and the 27th at the end of the month.
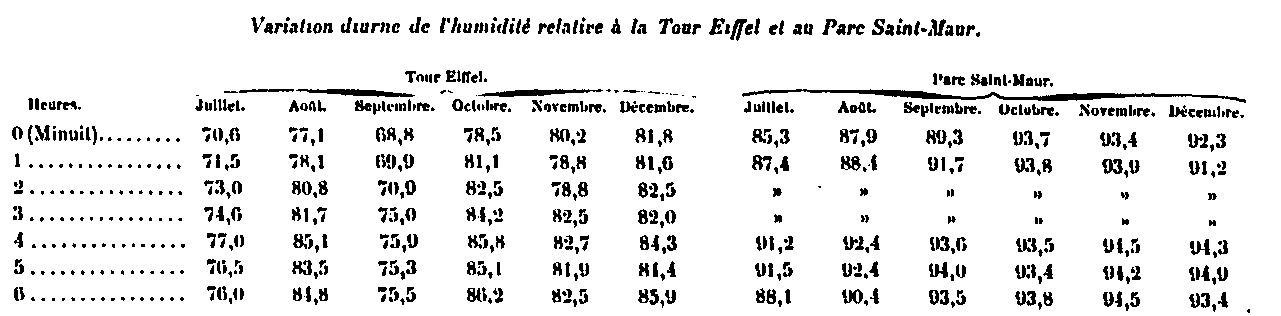
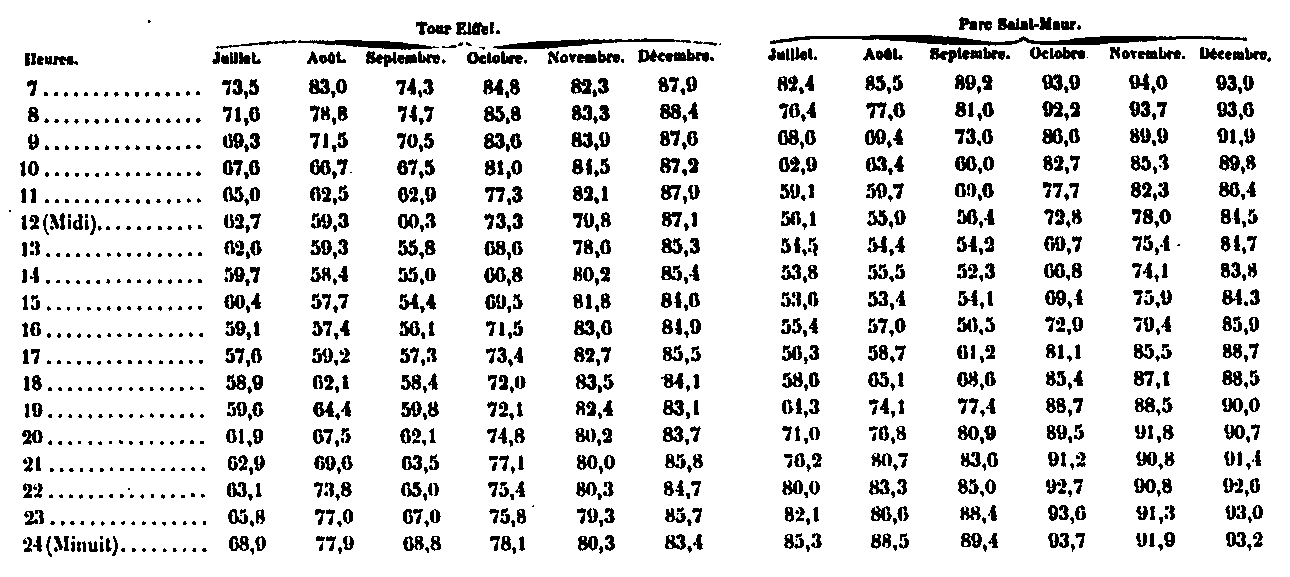
It can be seen from these numbers that the amplitude of the diurnal variation of the relative humidity is, like that of the temperature, much less at the top of the Eiffel Tower than at the Parc Saint-Maur. The difference is almost entirely in the numbers of the night: while in the layers near the ground the air is very close to saturation during the night, at 300 m height, on the contrary, the relative humidity varies much less and the air stays drier. This phenomenon was easy to predict.
Annual variation and irregular changes in relative humidity. Monthly averages of relative humidity at the Eiffel Tower and Saint-Maur are shown in the following table; we will point out again that the numbers relating to the months of July and December in the Eiffel Tower are not comparable to those of Saint-Maur, because, in each of these two months, there were only twenty two days of observation.
In all months, the relative humidity is lower in the Eiffel Tower than in Parc Saint-Maur; this difference is due solely to the night, during which the air is always on average drier at 300 m in height than near the ground, as we have indicated about the diurnal variation.
Accidental changes in relative humidity, like those of temperature, are much greater and faster at the Eiffel Tower than near the ground, and these variations frequently have no analogy with those of the lower layers of the atmosphere. Often, while the humidity is only 7c to 80 below, the air is saturated at the top of the Tower, which is in a layer of real clouds; conversely, while below the air is saturated and we are in the fog, it can be very beautiful and very dry at 300 m.
The period from November 21st to 24th, which we have already reported about pressure and temperature, also offered some interesting peculiarities for humidity; on the night of 21 to 22, between 1 am and 4 am, while the temperature was 120 higher on the Eiffel Tower than in Saint-Maur, the relative humidity ranged from 30 to 24 at the top and at Saint-Maur was constantly equal to 100. At the same time, the steam tension remained between 3.7 mm and 3.9 mm at Saint-Maur, and between 2.2 mm and 2.6 mm at the Tower Eiffel; after 4 o'clock in the morning, on the contrary, although the relative humidity at the tower remained much lower than at Saint-Maur, the vapor pressure became greater.
The general conditions of humidity, as well as of temperature, can therefore differ extremely to 300 m in height from those observed near the ground.
Rain and evaporation
When Gustave Eiffel set up a meteorological laboratory at the top of the Eiffel Tower, he equipped it with a rain gauge, a device whose function is to measure the amount of rain falling from the sky. But he had to face the facts: Even during stormy days, the rain gauge was empty! The reason is given below, in the text he wrote himself to explain this curious phenomenon.
We will not give the numbers of observations collected at the Tower because they have no real meaning. The wind is so strong that in most cases the raindrops move horizontally and do not fall into the rain gauge. It has frequently happened that, during heavy downpours, not only did the rain gauge indicate nothing, but that the ground of the summit platform was not wet, and received only a few drops, while the vertical objects streamed of water. To obtain, under these conditions, numbers which have any significance, it would be necessary to completely change the ordinary mode of observation of the rain, and to collect it in a rain gauge whose funnel, instead of being horizontal, could bow and place yourself normally in the wind.
Wind speed

Initial anemometer of the Eiffel Tower
Initial anemometer of the Eiffel Tower

Initial anemometer of the Eiffel Tower.
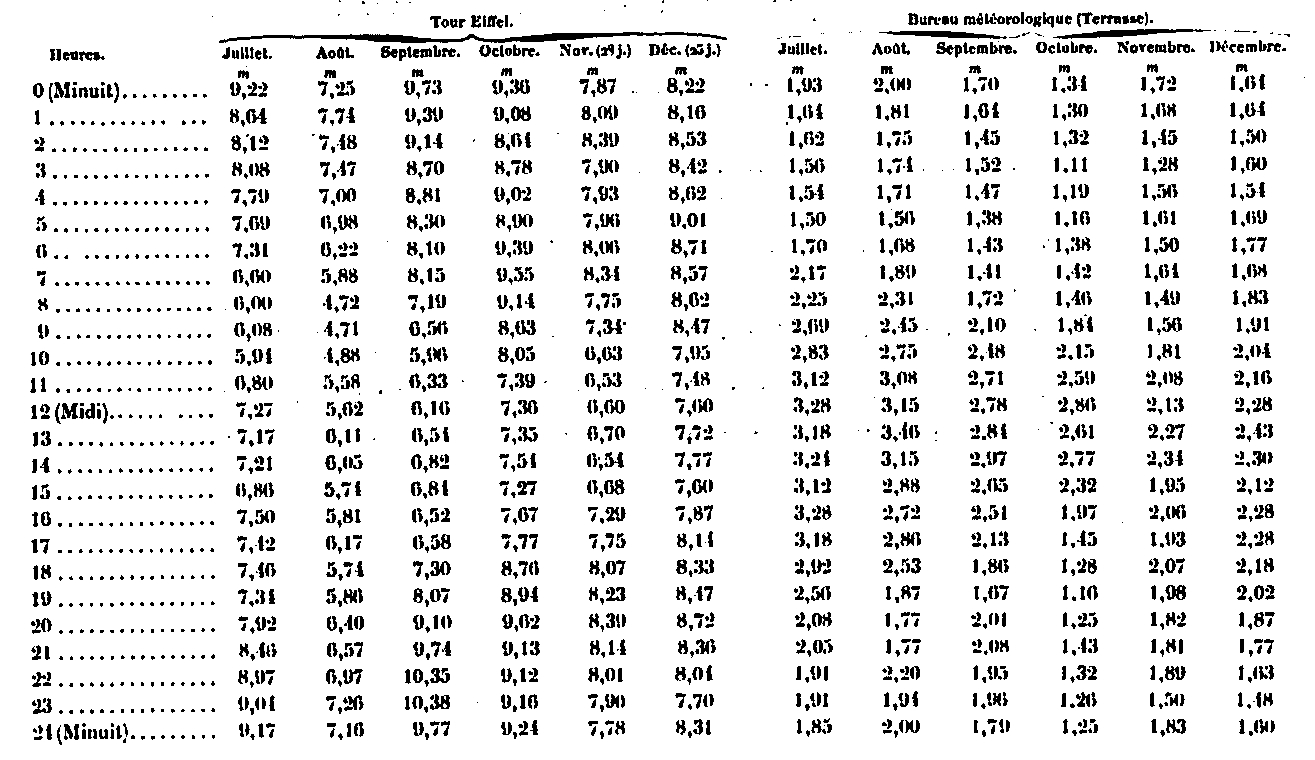
Installation of anemometers. The anemometers used at the Central Meteorological Office and at the Eiffel Tower are identical; they are anemometers imagined by MM. Richard brothers; they consist (Fig. 190, opposite) of a reel made up of six aluminum fins, inclined at 45 ° and riveted on very light steel arms: their dimensions are calculated so that the reel does exactly the trick for 1 m of wind; their march is, moreover, verified on a merry-go-round, and, if necessary, a correction table is established for each apparatus. Since the reel rotates in a vertical plane and must always be windy, it is mounted at the end of a horizontal vane and rotates about a vertical axis, which is placed very close to the plane of rotation of the reel. fins, so as to decrease as far as possible the distance that the reel must travel to orient itself. The orientation is ensured by a tail riveted to the other end of the wind vane, and formed of two plates of sheet metal adjusted at acute angle. The complete reel weighs only 150 g; it has an air surface of about 6 decimetres square, and its axis of rotation is constantly lubricated by a special device placed in the metal box that can be seen in the figure, immediately behind the reel, and which also contains switchgear devices.
"This instrument is remarkably sensitive and can measure speeds of no more than 0.1 m to 0.2 m per second; it starts to spin immediately as soon as the wind begins to blow, and stops as soon as the wind stops, while Robinson's reel, because of its large mass and low surface area, takes a long time to acquire. its speed and, once launched, continues to spin long after the wind has stopped.
Reels of this kind installed in the Central Office and the Eiffel Tower, transmit their information on cinemographers of MM. Richard brothers, who indicate both the speed of the wind at each moment in meters per second, and the time during which the wind has traveled a distance of 5 km. We reproduce the figure which indicates the disposition of the receiving apparatus (Fig. 191, opposite). The recording cylinder makes a revolution in one day, and one hour corresponds to a length of 15.15 mm; the minute is therefore represented by about 0.25 mm, still appreciable amount. The figure shows on the cylinder, at the bottom, the curve which gives at every moment the speed of the wind in meters per second; at the top, we distinguish the features of the totalizer, whose interval corresponds to a total distance of 5 km traveled by the wind. By measuring the area of the lower curve at the planimeter, it is easy to ensure that it always exactly matches the sums given by the totalizer.
The Eiffel Tower anemometer is installed at an altitude of 338.50 m and at a height of 305 m above the wind vane C (Fig. 188). During the duration of the Exhibition, the receiving apparatus was placed in the window of MM. Richard brothers, in the Palace of Liberal Arts. In November 1889 he was transported to the engine room of the Tower at the base of the South Pier. The observations began on June 16, 1889; there was a two-day interruption in November (the 10th and 11th) when the Exhibition Receiver was being transported to the Tower engine room, and six days in December, from the 13th to the 19th, as a result thick frost that completely immobilized the reel.

Cinemographers of MM. Richard brothers
Cinemographers of MM. Richard brothers

Cinemographers of MM. Richard brothers, measuring the strength of the winds
At the Weather Office, the Richard anemometer is installed at the north-west corner of the turret at an elevation of 54 m, and at 20.90 m from the ground. The receiving device is in the room immediately below the terrace. The recorders of the Eiffel Tower, which had been provisionally installed in November 1889 in the engine room of the Tower, at the base of the South pillar, were transported in November 1890 in a room on the ground floor of the Meteorological Bureau, which was connected to the Eiffel Tower by a 20-wire cable.
At the anemo-cinemograph of MM. Richard brothers, employed at the top of the Eiffel Tower since the origin of the observations and whose recording device is represented figure 191, was able, in October 1890, to add another cinemograph with instant indications, of which Mr. Eiffel donated at the Central Meteorological Bureau. The drawing is reproduced in figure 193.

Instant indication cinemographs
Instant indication cinemographs

Instant indication cinemographs
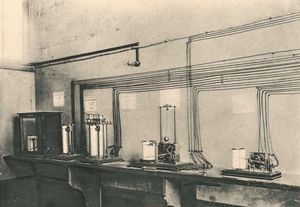
The 20-wire electric cable, which comes from the Tower through the sewers of the Champ de Mars and the rue de l'Université, ends in a communications box F from which the wires that leave are, as shown by figure, to the various receivers. These devices, all of which were designed and built by MM. Richard brothers, are the following:
- At the very end of the table is the thermometer. This apparatus operates in fifths of a degree, that is to say that as soon as the temperature at the summit rises or falls by a fifth of a degree, the pen of the receiver E rises or falls by the same amount. on a sheet of paper rolled up on a cylinder that makes a whole turn in a week. So we find at the end of the week on this paper a continuous curve which gives all the movements of the temperature during this time.
- The wind vane, which, by means of only three wires, records the variations of the wind direction by one hundred and twenty-eighths of circumference, that is to say, the apparatus is sensitive enough to give thirty- two intermediate directions between north and west, for example.
- The recorder of the vertical component of the wind; the feather of this instrument moves from left to right when the wind is rising, from right to left when the wind descends, and the movements are proportional, at each moment, to the speed of the wind in one direction or the other.
- Finally two anemometers which indicate the horizontal speed of the wind; the former is powered by the Robinson Reel, which is in use at most weather stations; the second is actuated by a special reel, much more sensitive and exact, imagined by MM. Richard brothers.
These last two instruments record the speed of the wind in meters per second on a cylinder which makes its entire revolution in a day, and on which it is difficult to distinguish time intervals smaller than a minute. As the speed of the wind varies with extreme rapidity, it is of great interest to be able, during storms, to obtain much greater details, and especially to measure exactly the maxima of speed. It is to this object that is intended the cinemograph with instant indications of MM. Richard brothers, which can be seen in G to the right of the figure. In this apparatus, the wind speed is recorded at every moment on a strip of paper that runs at a speed of 3 cm per minute; a second of time corresponds to half a millimeter, a perfectly appreciable quantity. This apparatus, which discharges in twenty-four hours a length of 43.20 m of paper, would be impossible to use in a common manner; it would be necessary to spend more than one day of work to raise the indications which it provides for a few hours; it is therefore reserved only for interesting moments, for storms.
For this purpose, it is provided with a kind of lock which is electrically controlled by the ordinary anemometer; as long as the latter instrument indicates a wind speed of less than 20 m per second, the lock is closed and this unit remains at rest; as soon as the wind speed on the anemometer reaches 20 m, the lock opens and the anemometer goes into action; the two apparatuses then operate simultaneously, the first giving the great variations of the speed of the wind and the other the smallest details, and that until the speed of the wind drops below 16 m per second; speed then stops again automatically.
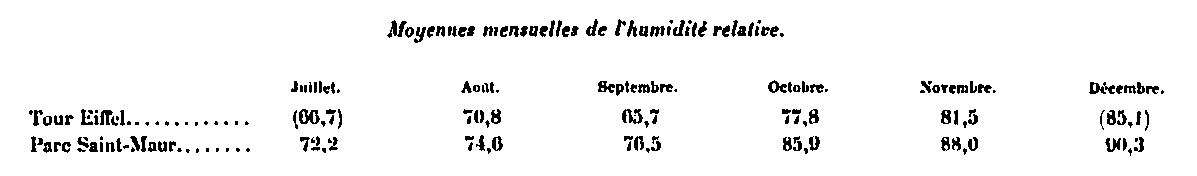
We give here (Fig. 194) two reductions of the curves obtained with this last instrument; in the original curves, the distance between two vertical lines, which corresponds to one minute, is exactly 3 cm.
Particularly note the curve obtained on November 24, 1890 between 7h27min and 7h28min of the morning; the wind at that time had extreme variability: in less than thirty seconds, it dropped from 34 m to 18 m; the corresponding pressures would have been 116 kg and 32 kg per m2, respectively. This shows to what enormous pressure variations a body is exposed in seconds during storms.
The other curve that was obtained during the gale of the night of January 20th to 21st, 1891, is, on the contrary, much more regular.
Among the instruments listed above, there is no barometer. It was recognized that the pressure variations at the top and bottom of the Tower were not very different, so that there was no point in transmitting downward the fluctuations of the pressure at the summit; they are recorded on the spot by an ordinary barometer.
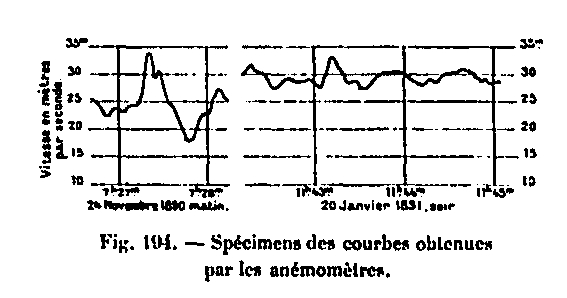
Diurnal variation of wind speed. In the following table, we give in the following table, for each month, the hourly averages of the wind speed in meters per second at the meteorological office and the Eiffel Tower, for the whole period that includes the observations until the end of the year 1889 .
In every month, without exception, the diurnal variation of the wind speed at the Weather Bureau has the normal characters - there is a minimum in the morning towards sunrise time and a maximum around 1 o'clock in the afternoon. noon, and the amplitude is greater in summer than in winter.
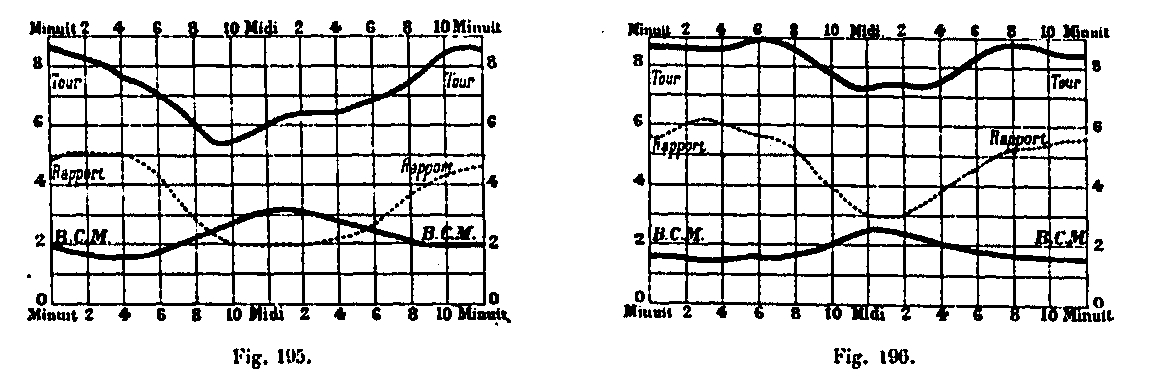
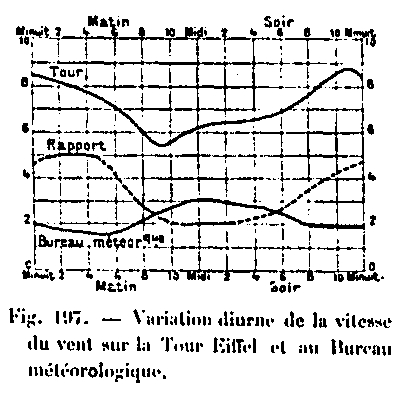
At the Eiffel Tower, the diurnal variation is quite different: the maximum is in the middle of the night and the minimum in the morning around 10 am in the hot season and later again in winter. These opposite characters can be easily seen in Figures 195 and 196, which represent the diurnal variation in wind speed at the Tower and the Office respectively during the three warm months (June-September) and the three cold months (October-December). that includes the observation period. The diurnal variation of the wind speed on the Eiffel Tower is thus quite similar to that observed at the top of the high mountains.
This inversion in the diurnal variation of the wind speed at the top of the Tower and near the ground is further highlighted by the punctuated curves of Figures 195 and 196, which represent the diurnal variation of the ratio of velocities in both stations. In the warm months as well as in the cold months, this ratio is maximum around 5 o'clock in the morning and minimum during the day; at night, the speed on the Tower is five to six times greater than in the office, while the ratio is only two to three in the middle of the day.
This is certainly the first time that there has been a diurnal variation similar to such a small height in the atmosphere, and it is one of the most interesting results that the observations of the Tower have furnished to this day. As a result, the diurnal variation in wind speed as observed in all observatories, a short distance from the ground, is a local phenomenon that is produced by diurnal warming in the lowest layers of the atmosphere. , which has already disappeared completely in the open air at a distance of 300 m from the ground.
Annual change in wind speed. In the following table we give the average values of the wind speed at the Eiffel Tower and the Meteorological Bureau for all the months during which observations were continued.
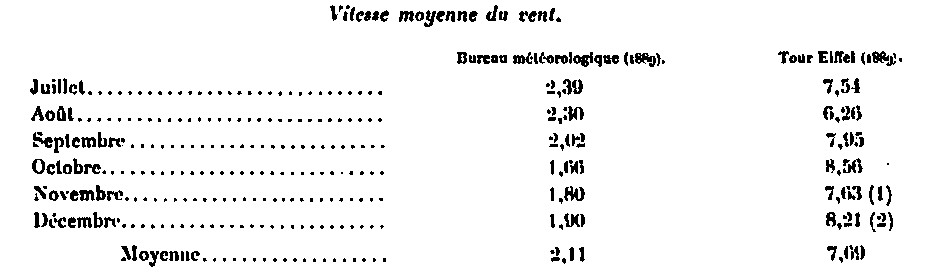
The observation period is still too short for us to deduce some conclusions about the annual change in wind speed. It should be noted that there is no analogy between the average speeds observed at the Tower and the Meteorological Bureau; in the last six months of 1889, the highest average speed at the Tower is that of October; the same month, on the other hand, is the one that gives the lowest average speed to the Weather Office.
The average speeds given above are the averages of the twenty-four hourly observations; they necessarily differ a little from the true average that would be obtained by taking the quotient of the total path traveled by the wind by time. This difference comes from the fact that, since the wind is often very variable, twenty-four equidistant observations are not enough to represent exactly the phenomenon; the wind can, for example, fall to zero in part of the time, while it has a noticeable speed at times of observations.
The Richard filmmaker gives both the speed at each moment and the total of the path traveled by the wind in any interval; it is therefore easy to deduce the average true speed of each month. We give these values in the following table, which indicates, for each month of 1889, the total path traveled by the wind in kilometers and the corresponding average true speed in meters per second. The observations of the first two months, being incomplete for the total of the path traveled, do not appear on this table.
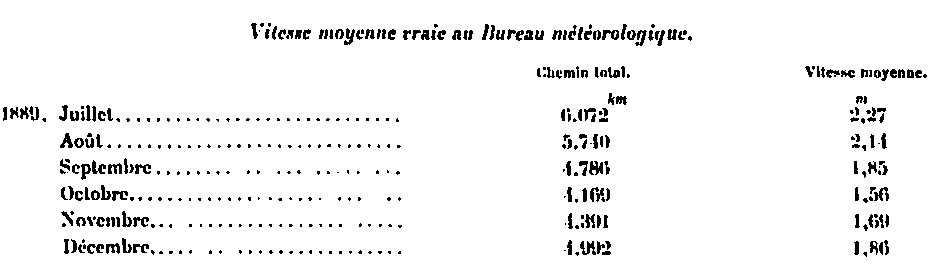
The true average speeds thus obtained are all lower than the averages of the twenty-four observations. The average difference is 0.12 m, the extreme differences being 0.17 m (September) and 0.04 m (December).
At the Eiffel Tower, where the wind is much more regular than near the ground, there is no appreciable difference between the true average and the average of twenty-four hours
Wind direction
Observation methods. The direction of the wind is recorded continuously at the Central Office by means of an ordinary two-wing weather vane, very mobile, placed at the north-east corner of the turret; the axis of this wind vane directly controls a vertical cylinder on which is wound a sheet of paper; a feather, moved by a clockwork movement, descends in twenty-four hours following a generatrix of the cylinder and thus marks at each instant the direction of the wind. The circumference, which corresponds to a complete rotation of the wind, has on the paper 157 mm in length, and the feather falls exactly one centimeter per hour.
At the Eiffel Tower, the wind vane is installed in C (Fig. 188). It consists of two wheels mounted on the same horizontal axis and whose assembly can move around a vertical axis; when the wheels are not oriented exactly in the direction of the wind, they start to turn, which at the same time changes their orientation. This arrangement has the advantage, while maintaining a great sensitivity to the device, to reduce the sudden oscillations that frequently have wind vanes.
By means of a special three-wire electric transmission system designed by MM. Richard brothers, all the movements of the wind vane reproduce at a distance on a vertical cylinder identical to that of the Weather Station's weather vane, which we have described above. The contacts are set up so that the transmission is 1/128th circumference, that is, it is sufficient for the wind direction to change by 1/128th circumference, that is to say 2 ° 48 "45 'so that the receiver cylinder placed at a great distance rotates in the proper direction of the same quantity, this interval is so small that the This curve reproduces exactly the appearance of the curves obtained by direct mechanical transmission.Within the duration of the Exposition, the receiving apparatus was placed next to those of the anemometers, in the window of Messrs. Richard brothers, from November 1889 to In October 1890 he was transported to the engine room of the Eiffel Tower at the base of the South Pier, and since October 1890 he has been permanently installed in the Meteorological Bureau itself.
The stripping of the curves obtained both at the Office and at the Eiffel Tower was done in the same way, by raising the direction of the wind every hour; this direction is noted in numbers from 0 to 32, 0 corresponding to North, 2 to N-N-E, 8 to East, 16 to South, 24 to West, and so on. The direction of the wind is therefore appreciated to less than 1/64th circumference, that is to say about 5 °, which seemed sufficient. The direction of the wind was removed and noted calm whenever the wind speed at the time of the observation was less than 0.5 m at the meteorological office and 1 m at the Eiffel Tower, because below these limits it was is no longer sure that wind vanes obey the wind and orient themselves exactly.
Wind direction at the meteorological office and at your Eiffel Tower. We give in the following table the number of times that the wind has blown from each direction in all the months, and the number of calms, considering, to abbreviate, only the four quadrants North, East, South and West, without holding intermediaries which are detailed in Mr. Angot's report.
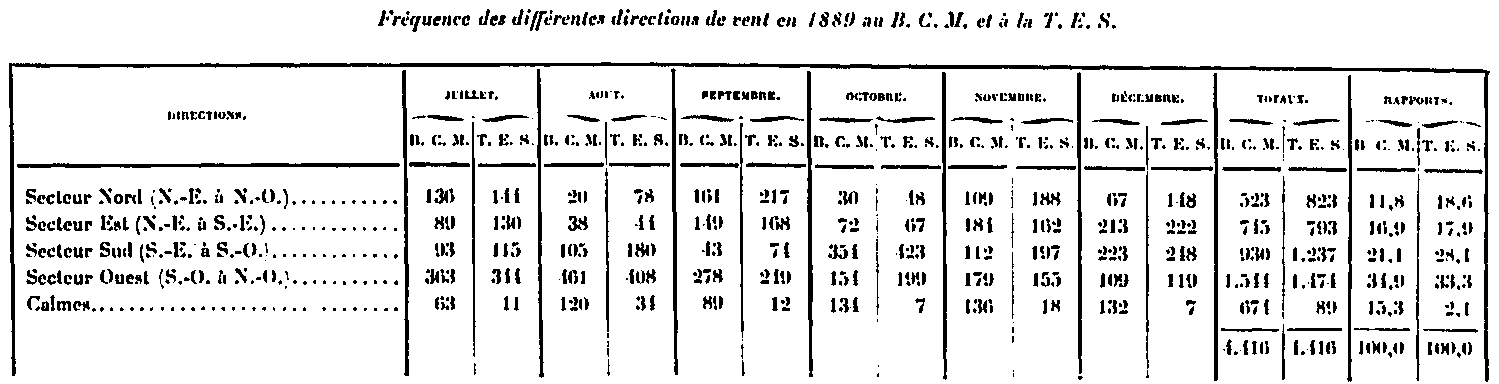
It results from the examination of this table:
- That the number of calm days is much larger at the base than at the top of the Tower, 15% and 2%
- Winds in the North and South are much more common at the top than at the base
A similar pattern, established for the next five years, indicates the same proportion of calms, but a predominance of the West sector winds over the others.
Outside the wind vane and the anemometers of which we have just summarized the data, we installed at the top of the Eiffel Tower, in July 1889, a reel intended for the study of the vertical component of the winds. This instrument, designated by the letter B in Figure 188, consists of four flat fins, inclined at 45 ° and movable about a vertical axis. By its very construction, this reel remains motionless in a horizontal air current, rotates in one direction when the wind has an ascending vertical component, and in the other direction when the wind has a descending vertical component. However, the observation of this instrument presents great difficulties; it can turn even in a perfectly horizontal current, if the speed of the wind is not rigorously the same at both ends of the diameter of the reel, and for that it is enough of the smallest obstacle. The first observations, obtained in 1889, revealed a cause of error of this kind, due to the presence of the central rod which carries the lightning rod.
General Review of the 1889 Observations
M. Angot summed up, in an article published in "La Nature" of January 25, 1890, all of his observations of 1889. We reproduce it below, because of his interest, although there are some repetitions compared to the detailed review just outlined.
What strikes first in the wind observation is the quite unforeseen force that it already has at 300 m height. The first one hundred days of observations collected between mid-June and October 1, in the warm season, gave an average speed of 7.05 m per second, or more than 25 km per hour. During the same period, an instrument identical to that of the Eiffel Tower, placed on the turret of the Central Meteorological Bureau at 21 m above the ground, and at a horizontal distance of about 500 m from the Tower, indicated only a speed average of 2.24 m, that is to say a little less than a third of what was observed at the top of the tower. It was well known that the speed of the wind increases with height, for, near the ground, the movements of flight are hindered and retarded by the friction against all the asperities, hills, houses, trees, & c. ; but we did not admit so far a law of variation so rapid. This fact is of great importance for studies relating to air navigation; it is important, indeed, to know how long, on average, the wind speed remains below this or that value, against which the dirigible balloon machine can advantageously fight. During the period we studied, the wind speed at 300 m was 39% of the time greater than 8 m per second, and for 21% greater than 10 m.
Anemometric observations of the Eiffel Tower have highlighted another fact even more unforeseen than the very magnitude of the wind speed: this is the way this speed varies regularly during the day.
The two curves in solid lines of figure 197 give respectively for the Eiffel Tower and the Meteorological Bureau the law of diurnal variation of the speed of the wind. At the Meteorological Office, as elsewhere in all low stations, the speed is lowest at sunrise (1.6 m at 5 o'clock in the morning) and highest at midday (3.1 m at 1 o'clock). evening time). At the Eiffel Tower, on the other hand, the smallest speed (5.4 m) is observed between 9 and 10 o'clock in the morning, and the greatest occurs in the middle of the night (8.8 m at 11 o'clock in the evening). ). This is almost exactly what happens at the top of the mountains, like Puy de Dome and Pic du Midi, where the wind speed is maximum during the night and minimum in the middle of the day, following a reverse low regions. This inversion is further highlighted by the dotted curve in Figure 197, which gives for each instant the ratio of wind speeds to the Eiffel Tower and the Meteorological Bureau. This ratio is the largest and equal to 5 between 2 and 4 o'clock in the morning, the smallest is equal to 2 between 10 o'clock in the morning and 3 o'clock in the evening; its diurnal variation has exactly the characteristic shape of that of the velocity of the wind on the mountains. This is certainly the first time that a similar variation has been reported at such a low level in the atmosphere.
From the point of view of the speed of the wind, considered either in its absolute size or in its diurnal variation, the Eiffel Tower is much closer to the mountain stations than ordinary stations. It is the same for the temperature. Assuming, as usual, a decrease of 1 ° for 180 m of altitude, the thermometer should be constantly lower at the top of the Tower than at ground level, in the countryside around Paris, at the Parc Saint-Maur Observatory, for example. We have taken this station as a term of comparison instead of a point situated in Paris itself, closer to the Tower, because the temperature of Paris does not exist, strictly speaking; it is absolutely artificial and can vary by several degrees depending on the replacement of the instruments, the state of the sky, the direction of the wind, etc.
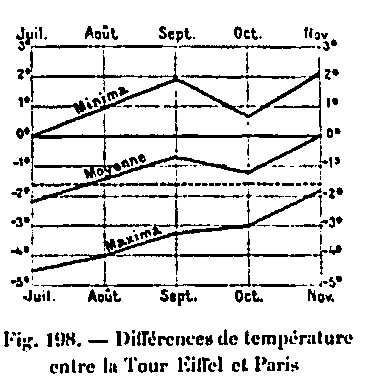
Figure 198 gives, for each month, the average difference between the Eiffel Tower and Parc Saint-Maur, not only for the average temperature (middle line), but for the minimum temperature of each day (top line) and for the maximum temperature (lower line).
In every month without exception, at the time of the daytime maximum, the temperature at the top of the Tower is lower than at the foot; the difference is even much greater than the theoretical value of 1.6 ° which we have indicated, and which is represented on the diagram by a punctuated line; the days are therefore relatively cold at the summit. On the other hand, the nights (minimum, upper line) are very hot: not only the difference between the summit and the base does not reach 1.6, but it is the summit which is the hottest in absolute value. At the top of the tower, the days are relatively cool and the nights are hot; the amplitude of the diurnal variation in temperature is much less than near the ground.
The main cause of these differences is the weakness of the absorbing and emitting powers of the air, which heats very little directly during the day and also cools very little during the night: the diurnal variation of the temperature, a certain height in the open air, must therefore be small; it becomes greater in the lower layers of the atmosphere, to which the considerable variations of temperature which the soil undergoes are communicated by contact. In the first 200 or 300 meters of air from the ground, the decrease of the temperature is thus very fast during the day and very slow at night, where even it is normally warmer at a certain height than near the ground, when the weather is calm and beautiful. These considerations are verified in the most complete manner by the observations of the Tower; in calm and clear nights, in particular, the temperature is frequently 5 to 6 ° higher at the summit than at the base.
Similar differences have been observed frequently in mountain observatories; but they are much less marked. In these stations, the mass of the mountain still exerts a considerable influence, while the Eiffel Tower is really in the open air. Thus, the amplitude of the diurnal temperature variation at the Eiffel Tower, at 336 m above sea level, is almost equal to and even less than that observed at the summit of the Puy of Dome, at 1470 m.
The annual march of the temperature at the top of the Tower (middle line, Fig. 198) seems, as far as can be judged after only five months of observation, to follow the same laws as the diurnal variation. ; the average temperature seems lower than normal during the hot season, and higher, on the contrary, during the cold season. Apart from these regular causes, accidental causes can produce even more remarkable temperature differences between the top and bottom of the Eiffel Tower. At the time of change of weather, the change sometimes occurs completely at 300 m height several hours and even several days before it occurs near the ground. Last November provided a striking example.
From 10 to 24 November, there was a period of high pressure on our regions, with calm or very weak winds generally coming from Test, and low temperatures, especially in the last days; it is only in the day of the 24th that the wind passes south-southwest and becomes strong; the temperature rises, the sky is covered and bad weather begins. However, at the Tower, the temperature was still low on the 21st with a weak wind from the South-East, when, towards 6 pm, the wind suddenly takes strength and turns to the south, then settles to the south-southwest. ; at the same time, the temperature, instead of falling, as it should have done normally, rises from more than 8 ° to about 2 o'clock in the morning on the 22, as can be seen in figure 199 which reproduces the curves of the recording thermometers installed at the top of the Tower and at the base (East pillar). Since that time, the temperature has remained high at the top, so that, in the whole interval between the evening of the 21st and the morning of the 24th, it has been constantly much warmer at the top of the Tower than at the ground. The change of regime was thus manifested at 300 m height more than two days before being felt in the lower regions. What is most remarkable is that nothing absolutely below could indicate this change; from the evening of the 21st until the morning of the 24th, the sky was constantly of perfect purity, without any cloud, and a complete calm reigned below, while at the top of the Tower a warm southerly wind blew southwest, with a speed of 6 to 8 m per second.
The observations of temperature, as well as those of the wind speed, show, in a completely unforeseen way, how the weather conditions at 500 m only height can differ from those which one observe near the ground. Despite its relatively low altitude, the meteorological station of the Eiffel Tower is therefore most interesting;
See also: