
Below is the report of the experience made at the top of the Eiffel Tower by Mr Cornu in 1899, an experiment used to record the dispersion of the dark light lines observable in the spectrum of the electric beams emitted from the top of the Tower. . this experience proves again the scientific interest of this tower, in full Paris.
Description of the expérience
It was natural to think that, in a horizontal direction, the terrestrial atmosphere absorbed the same radiations and produced the same spectral lines, called telluric lines, which are observed in the solar spectrum. The existence of several telluric groups in the spectrum of a projected beam of the Eiffel Tower on the Observatory of Meudon was, in fact, reported by Mr Janssen (Reports of the Academy of Sciences) and presented as a demonstration of the terrestrial origin of groups A and B, as well as some bands due to water vapor. I proposed to carefully examine the series of dark lines observable in the spectrum of the electric beams emitted from the top of the Tower, and to compare them with those shown in the spectral maps that I had previously published. It was, moreover, a direct and valuable verification of the method of the oscillation of the lines which had led me to distinguish individually the solar origin lines and those of terrestrial origin, in the most complicated groups of lines of the spectrum solar.
The study was undertaken at the École polytechnique, in the local and with the devices that had been used for research in solar spectroscopy. This study, begun on October 24, 1889, using, at first simply, the light of the flashing beacon of the top of the Tower, was continued with the beam of one of the projectors of 90 cm of MM. Sautter and Lemonnier, whom Mr. Eiffel was kind enough to direct from 8 am to 10 am on the École Polytechnique from October 27 to November 6, the day of the closing of the 1889 World's Fair and the extinction of projectors. The distance from the Tower to the School, measured on a map of Paris at 1/12 500 is approximately 4 350 m. The agent in charge of the searchlight immediately recognized the point of the horizon towards which he was to direct and maintain the beam. To this end, I had arranged, at home, near the window of the attic of the Pavilion of Students where were installed my devices, a large lens 24 cm in diameter and 45 cm focal length: it had been set, by day, by the condition to bring the focal image of the upper gallery of the Tower in the middle plane of the flame of a moderator lamp that was lit at dusk, which allowed to check the setting. Reciprocity of the conjugate foci of the lens ensured the sending of a beam of light which covered the whole gallery where the searchlights were in battery: the agent in charge of their maneuver saw in the requested direction an extremely brilliant disk, impossible to confuse with the glittering points of the horizon. A red glass interposed near the flame made the distinction even easier.
I used, depending on the circumstances, four spectroscopes of increasing dispersion:
- A direct vision spectroscope of Duboscq with lateral scale;
- A Brunner goniometer, equipped with two quartz prisms and quartz-fluorite lenses with a focal length of 50 cm for photographing the spectra;
- The same goniometer with a Flint prism and Crown and Flint lenses with a 45 cm focal length;
- Finally, a large planar network of Rowland observed with a collimator of 1 m and a telescope of 1.40 m.
The slit of the collimator was illuminated by the image of the headlamp of the Tower concentrated by an astronomical objective of 16 cm in diameter and 2.30 m of focal length. The results were entirely in line with my expectations: during the favorable evenings, I was able to make a complete study of telluric groups A to B and D, first with an average dispersion: but what mattered most to me was to be able to use the wide dispersion of the second-order spectrum of the Rowland Network; I have succeeded several times, as is shown in the summary given below of the results obtained in each evening.
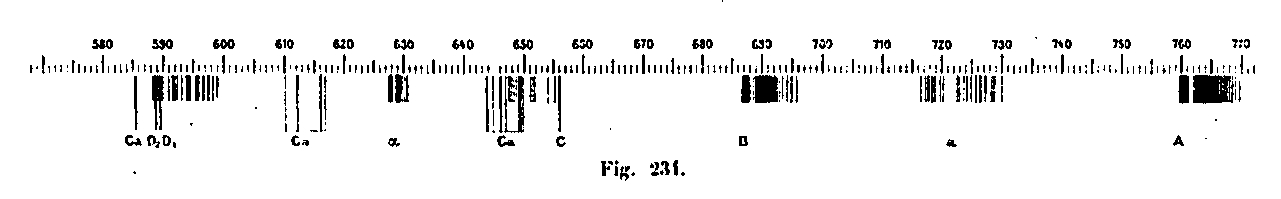
I would have liked to pick up all the dark lines visible with this great dispersion at micrometer: unfortunately the sky gradually faded: the rain and the fog increased more and more. So I could only imperfectly realize this part of my program, the darts becoming every day more difficult and more painful, lack of luminous intensity. Fortunately, this long work became largely useless, thanks to the characteristic configuration of the groups that reproduced exactly those of my cards, so that a small number of dots were enough to ensure their complete identification: it was, in fact final, the goal that I had proposed.
Summary of results obtained
October 24, 25 and 26, 1889
First tests with the direct-view Duboscq spectroscope: a small collecting lens, then the 16 cm objective project the linear image of the Tower Lighthouse onto the slot. Recognized and recorded various bright lines of metal arc vapor (sodium, calcium, magnesium), as well as several dark lines, on the continuous spectrum of coals in the red region of the spectrum. The comparison of these records with those made in the day of the 27th, with the sunlight, shows that the dark lines represent A a and B. (A and B are due to the absorption by the oxygen of the air; by the water vapor.)
October 27
Received the beam of the projector 90 cm. Excellent brilliance. It is easy to read a newspaper by the light coming from the projector. Glossy spectrum. Collective lens of 50 cm of focus. Observed many details on A, a B on the watery lines, near C and D, which is double and reversed. Improvised an essay with the Rowland Network. - Preview the flutes of D.
October 29
Brunner Goniometer. - Flint Prism (60cm), - 10cm lens to focus the image of the projector on In slot. - Record, on the divided circle, the principal lines in groups A, a, B and some watery lines close to D; in addition, several brilliant lines of calcium. The beam brightness becomes large enough to use the Rowland spectroscope. The two lines D (sodium vapor) are magnificent even in the second spectrum: they are reversed in the middle of their length, and shiny at the ends. - In their neighborhood, all the watery lines of my map are there (the solar lines alone, naturally, are lacking): I am one by one in the first spectrum. I can also follow in detail the structure of group B up to the 8th doublet; beyond that, the light intensity is too weak. At first I had thought of picking up all these lines at the micrometer; but their arrangement is so well known to me, and the concordance with my card so perfect that I do not think it useful to waste time and to tire of seeing these dots. The α group (due to oxygen) is weak; it is especially altered in its ordinary aspect by the intensity of the aqueous lines it contains; however, it is recognizable; I can also follow the groups of watery lines located between B and C, which I marked as such on the Atlas of Fievez.
October 30
The brightness of the projector is very bright. - The group R is admirable in the second spectrum. - I see at least until the 11th doublet and the watery lines that follow, in particular the very strong line λ = 695.58 - Verification of aqueous lines, near C. - Past all evening to specify the identification of the group α, very weak and impaired by the predominance of aqueous lines. - Leaving, I leave the wire of the micrometer on one of the characteristic lines of α: the next day, at 2:50 pm, I note, with the sun, that it is the line λ = 627, 68 of α. Throughout the evening of October 30 the intensity of the light was so great that, without noticing it, I observed constantly, in the second spectrum. The dispersion was so clear that in the neighboring group of D I split the aqueous line λ = 592,26.
October 31
The sky clears: the air cools and becomes cloudy, the brightness is less vivid than yesterday. - One pushes the amiability to send me simultaneously the beams of the two projectors: but I can use only one, their angular difference being too large. - The watery lines are much less marked: the two lines D are almost stripped. - In contrast, the group has become much more recognizable. - Group B is very little visible both in the first and second spectrum. - Despite the increasing haze, the purple HK lines are visible, and even the ultraviolet band of carbon with the Brunner goniometer. - The smoke of the electric factory of the place of Pantheon gne a lot.
November 2
Beautiful evening. - Addition of a Geissler tube to hydrogen, to produce line C as a marker in the field of the Rowland spectroscope. - Verification of the aqueous groups in the vicinity of C, in comparison with this line and the bright lines of calcium. Very well seen the group α: the brightness of the field is bright enough to show until the fourth doublet of K and allow to perform dots. - Measured the distance of the strong line λ = 627.68 (oxygen) and the aqueous line λ = 629.14 located in the middle of the 2nd doublet of α two measurements gave 3'10 and 3'11 per micrometer with wire: on November 4th, the same measurement, made with solar light, gave 3'105: the identification is perfect. The aqueous group of D is admirable; it's exactly my card: I split 592,26.
November 3
Rainy evening: nevertheless the light is quite bright. - Photography test of the refrangible part of the spectrum. - Brunner Goniometer. - Collecting lens in fluorite quartz. - Double quartz prism at least deviation on the violet line 423 of calcium. - Obtained 10 purple and ultraviolet spectra on 4 gelatin plates. - Poses ranging from five seconds to two minutes. - No telluric band. - We see only the continuous spectrum of coals, the two fluted fluted bands of carbon, the brilliant lines H el K of calcium, H'K 'of aluminum and some others. - Contrary to what one might have thought from the meteorological state, the ultraviolet spectrum is rather extensive and seems limited to the wavelength λ = 329 only by the absorption of the windows closing the opening of the projector and the defect of ultraviolet reflection of the concave mirror in silvered glass.
November 4
A little mist and smoke from the Pantheon factory. - The watery lines close to D have become very visible again. - Micrometric identification tips. - Checked the existence of the aqueous line λ = 588,27 which almost doubles a line of iron on my map and that the sway of the latter discovers clearly. - Well seen the group, but nothing more than previously. - Group B is very beautiful, opening the slot. - Preview the aqueous line λ = 692.57 between the 10th and the doublet and those stacking the 11th, namely λ = 692.81; 692.83; 692.89.
November 5
Rain all day: fog in the evening; the beam has a very yellow color. Nevertheless the red region of the spectrum is bright enough that I could make a fairly long series of dots between B and C. The 34 micrometric dots were reduced in wavelengths taking as reference the line C (λ = 646 , 18) borrowed from Geissler's tube and a brilliant ray of calcium (643,81); six other bright lines of calcium were identified with solar metallic stripes and the other dark stripes with those that I had marked as telluric on the plate of the Atlas of Fievez and on an unpublished card which I built formerly with the Mr. Obrecht's competition.
November 6
Misty evening. - pale and yellow light. - Watery lines very erased. - They were already there at 2 o'clock in the afternoon. - No useful observations.
After the closing of these evening observations, I asked the Central Meteorological Bureau the data collected at the top of the Tower relating to the state of the atmosphere from October 28th to November 6th. Here are the figures that have been transmitted:
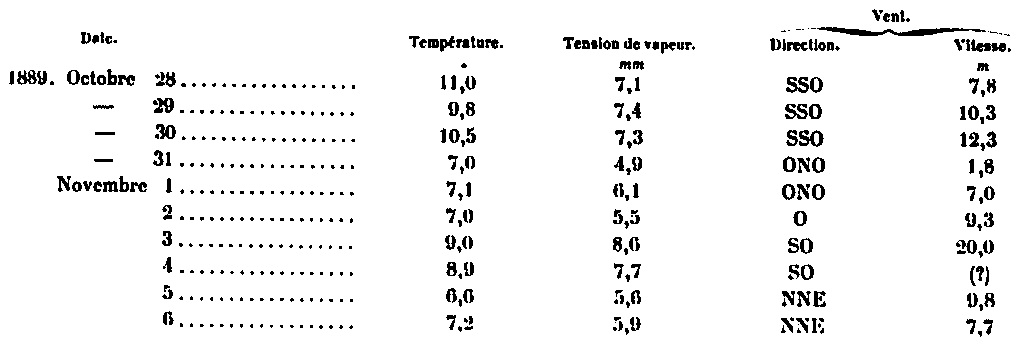
The variations of temperature and humidity are too weak to usefully intervene in the discussion of the spectral lines visibility: the direction and the intensity of the wind seem to have exerted more influence. In summary, the aqueous lines were sometimes more visible, sometimes less visible than those of the dry atmosphere (bands A, B, α): the variation of the humidity of the air and the direction of the wind naturally explain this effect . The lines of the dry atmosphere have always been less marked than in the solar spectrum: this is due to the small distance (4 350 m) traveled by the light beam compared to that traversed by the solar beam, the star being even assumed at zenith. It is indeed easy to show that the absorbing mass of the 4 350 m is hardly more than half that contained in a vertical column of the same base rising vertically to the confines of the atmosphere. The weight of the atmosphere over one square meter is, as we know, equal to the weight of a mercury mass of the same base having a height of 76 cm, that is to say 0.76 x 13,596 Kg = 10 333 Kg. The cubic meter of air at the surface of the globe weighing 1,293 kg, the vertical height of a column of air of uniform density would be 10,333 / 1,293 = 7,991m.
The horizontal column of 4 350 m having the same base, therefore contains a smaller air mass in the ratio of 4 350 to 7 991, that is to say from 1 to 0.544, a ratio a little larger than 1 / 2. It is therefore not surprising to see the lines of the bands A, B, α relatively less dark than in the solar observations where the star is near the zenith, and, even more so, near the horizon.
Conclusion
As a result of the spectral observations summarized above, nearly two hundred dark lines produced by the atmospheric absorption of radiation from a terrestrial light source have been identified individually with so-called telluric lines observed in the solar spectrum. The atmospheric origin of these lines is therefore superabundantly verified.
See also: