
Although it is metal, the Eiffel Tower oscillates on its base, but of course it is only the summit which in suffer the consequences, it moves slightly in one direction or another. There may be several causes for this phenomenon, but only two have importance: The temperature, which expands the metal, and the wind, which offers a horizontal force. The other causes are perfectly negligible: difference in atmospheric pressure, efforts due to vertical winds, disturbances due to the visitors of the tower, all of which would be massed on one side, etc. All that does not count in moving the top of the Eiffel Tower. On the other hand, the temperature and the wind, yes.
Just to say it right away, the biggest deviation ever seen from the top occurred during the storm of 1999, a storm during which the oscillation was 13 cm. Usually, it is rather between 4 and 8 cm, as shown in the statements below.
Measurement methods
From the first years after the construction of the tower Gustave Eiffel had measured the movements of the summit, but we can ask how he did it, since at the time he did not have the tools technollogiques that exist our days. In fact, he used two methods. The first was to put a sight overhanging the summit and a telescope at ground level, perfectly fixed on the center of the sight. With time he noticed a shift of the sight, the telescope, it, remaining perfectly fixed. It is an interesting and perfectly reliable method, but one which requires a great regularity in the observations. This is how we distinguish between the movements due to the temperature and those due to the wind, it is enough to know the weather to deduce the type of movement that we observe.
The other method is more complex, it was implemented by the military, it consists in raising the position of the top of the tower by geodesic measurements. This method, the results of which are given below, is just as reliable as it has been done with great precision.
Positioning of the target
In order to measure these displacements, a protrusion made of varnished sheet was raised on the terrace of the third platform and on the east coast angle, the lower face of which looked at the eastern pillar bore concentric rings 20 mm wide. alternately red and white. The number of these rings was 10 and their extreme diameter 0.40 m. These rings were numbered and divided into sectors by the eight divisions of the quadrant.
This suitably oriented pattern was observed using a theodolite attached to a solid masonry solid at the base of the East Pillar. It had been settled once and for all by calm weather, without sun, and at a temperature of about 10 °, so that the crossing of the threads of the reticle coincided with the center of the sight. When a displacement occurred, the center of the reticles projected itself on one of the circles or between two concentric circles; the number was read and the position on the corresponding sector was noted, which was immediately reported, as nearly as possible, on a paper chart representing the reduced scale pattern.
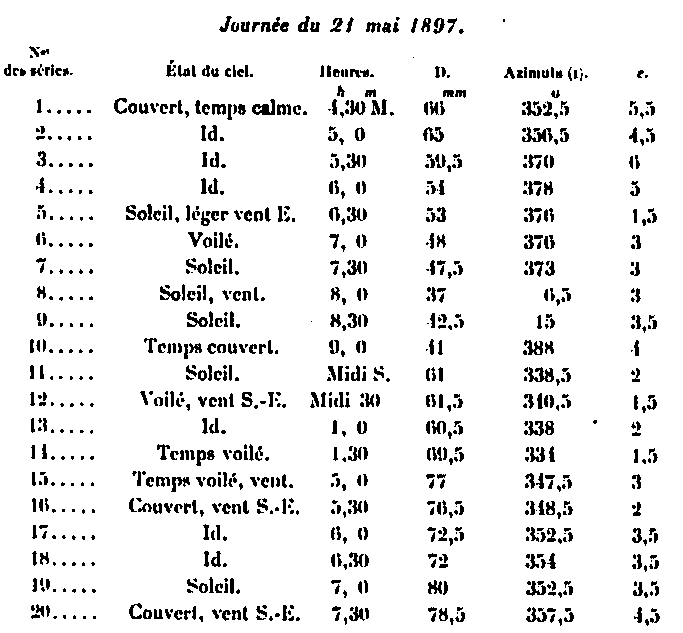
From 1893 to 1895, in order to record the displacements due to temperature, observations were made in a more or less regular manner at seven o'clock in the morning, at noon and at seven o'clock in the evening. In addition, some additional observations were accidentally made when there were high temperatures. During this same period, and whenever gusts of wind occurred, we observed the movements with a large telescope of 2.50 m focal length, and we reproduced on the paper, as exactly as possible, the dimensions and the position of the curve in the form of an ellipse, traversed on the target by the crossing of the threads of the reticle.
This series of observations has given rise to a large number of diagrams, of which we will confine ourselves to examining a few.
Oscillations due to the wind
The diagrams that indicate them are by far the least numerous, first because the gales, which alone act on the Tower in a sensible way, are rather rare, then because they occur most often during the night hours to which no observations were made. Even during the day, the sight is often masked by the rain that usually accompanies the high winds.
It has been possible, however, on several occasions to observe that under the effect of the wind the summit describes approximately an ellipse whose center varies with the position of the summit at that moment (position due to the circumstances of temperature, as it will be indicated below) and whose major axis is related to the wind speed.
Thus, on December 20, 1893 (see Fig. 223) between 11 am and noon, one of the days during which the displacement was maximum, the major axis of this ellipse was 0.10 m and its minor axis 0.06 m. The wind direction was South and the mean maximum was 31.8 m; but the actual speed given by the instant indication apparatus was much greater and reached 44 m. It is remarkable that at this maximum speed, which occurred at 11:25, the corresponding ellipse had a major axis of only 0.06 m. The enormous jolts that occurred at that time had a lesser effect of displacement than those due to a more continuous wind.
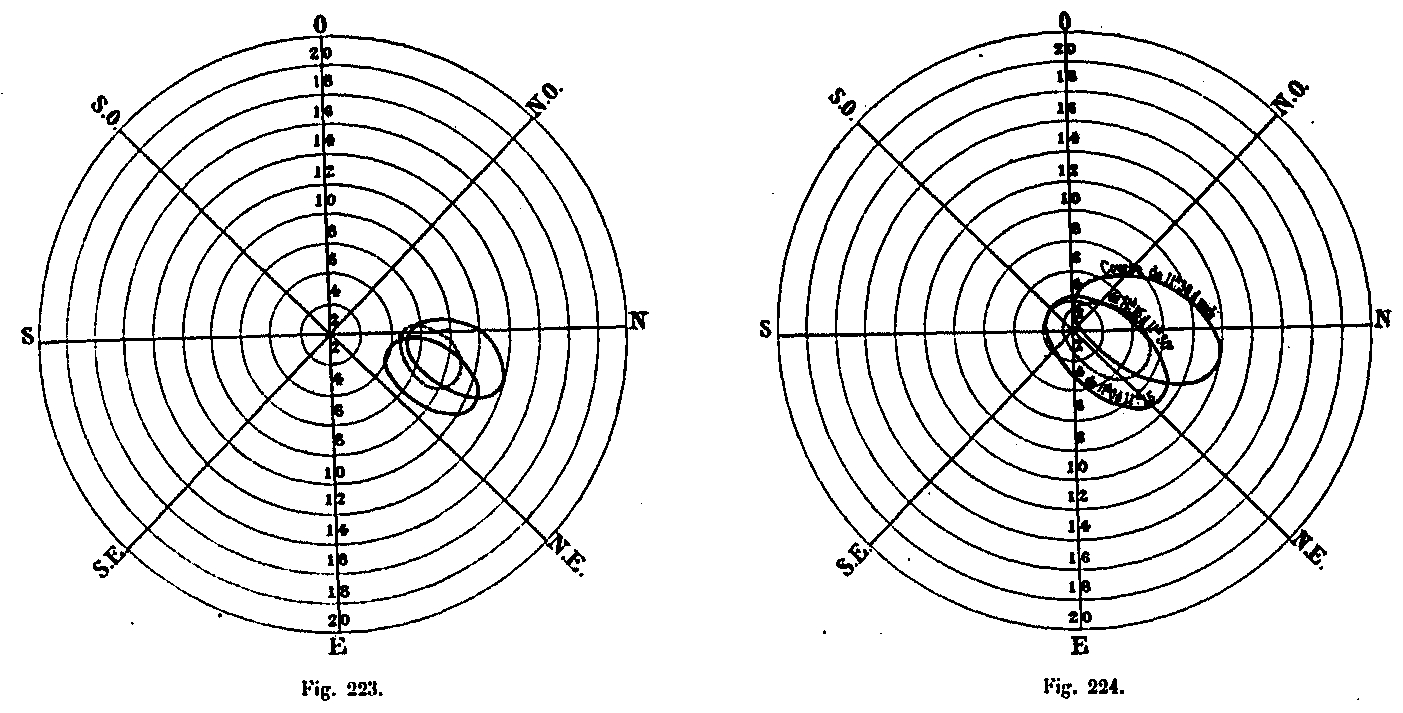
In the great gale of November 12, 1894, the observation was made from 3 to 4 hours. The average speed varied from 27.6 m to 30 m at this time with an absolute maximum speed of 42.50 m (see Fig. 224). The major axis of the ellipse was 0.08 to 0.06 m, the minor axis 0.04 m. It has also been found, as before, that it was under great jerks that the displacement was the least; it reached only 0.05 m. The strongest storm occurred at 6:12 am (maximum average speed 42 m), but at that time the displacement was not measured, nor was the absolute speed that may have gone up to 50 m.
The displacement of 0.10 m is the maximum observed. Under ordinary strong winds, the displacement is only 0.06 to 0.07 m.
It is much lower than the one that the calculation made predict. There is therefore almost certain that the forecasts made for wind faction are far superior to reality. We have already noted it for the increase of the pressure per square meter. It is likely that the same is true for the evaluation of surfaces exposed to the wind.
Oscillations due to temperature
We said that the original position of the theodolite was fixed by choosing a day without wind, a cloudy weather and a uniform temperature of 10 °, then making the zero of the target coincide with the center of the reticle.
The same circumstances were repeated on 26 December 1893 and throughout the day the Tower remained stationary, this center corresponding to zero of the target.
At other times covered, but with a higher temperature (15 to 18 °), the combined observations of June 6th and 7th, 1893 gave very small displacements; the target moved in the morning from the center of the reticle by 0.04 m in the west direction and returned at night in the same position, moving extremely little at noon.
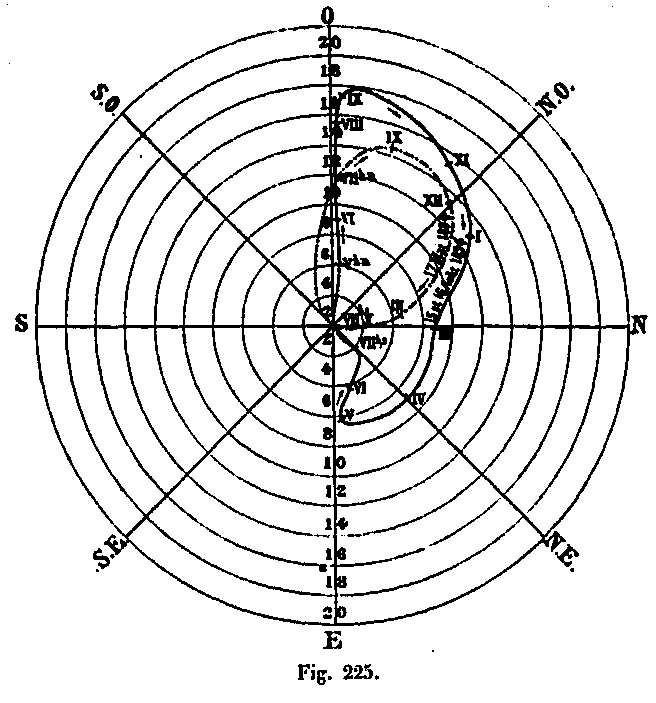
But when the solar heat acts on the Tower, the days of good weather, displacements take a great amplitude. We will take as an example the combined observations of August 15th and August 18th, 1894, which we will represent by the above graph (Fig. 225), in which the displacement of the pattern with respect to the fixed reticle is represented on a quarter scale. At 5 o'clock in the morning, the center of the target is placed on the west line 4 cm from the center; he stays on this line for up to 8 hours reaching 13 cm. It moves away from the North side reaching 15 cm. He then approaches the center, in the North-West sector, as the sun goes, that he seems to be fleeing. At 3 o'clock he is in the North line at a distance of 7 cm. The movement of rapprochement continues in the Northeast quadrant; from 5 o'clock and at a distance of 6 cm, the reticle returns frankly to the center which it must occupy around 8 o'clock in the evening; the total stroke is approximately 24 cm, parallel to the East-West axis and 10 cm from the North-South Tax. The Tower therefore seems to be fleeing from the sun and bowing in the Northwest quadrant, which is natural, since the ridges looking at the sun are the most heated, and further dilating, carry the top of the Tower. opposite side.
Curves are quite often simpler; such is that of May 17, 1894, which is entirely included in the North-West quadrant (see Fig. 225) and whose amplitude is 12 cm. It can be considered as an average curve in good weather.
When, on a beautiful day, the sun is veiled with alternatives, these curves become much less regular; the elongation and torsion movements of the Tower follow these alternatives in a very sensible way and the approximations or removals of the center coincide with the cooling or the heating due to the solar action. In summary, it may be said that the summit marked by the rod of the lightning rod is nearly constantly in motion; this movement is especially accentuated during the middle of the day, and it is only towards the hours of sunrise and sunset that it has a relative fixity; in the middle of the night only, it must be quite motionless.
This displacement of the summit makes it extremely difficult to ensure the perfect verticality of the Tower. However, in May 1893, M. Muret, geometer of the City of Paris, proceeded with the greatest care to this operation. He has found only a very insignificant difference which he himself attributes to a temperature effect.
Locating the summit by geodetic methods
General Bassot, Director of the Geographical Service at the Ministry of War, proceeded, at the request of the Monitoring Committee of the Tower, presided over by Mr. Mascart, to extremely precise geodetic measurements, with the aim of making a exact location of the vertex, so that the existence of a displacement can be verified later. These works were the subject of a communication to the Academy of Sciences (December 6, 1897), of which we reproduce excerpts below.
In April 1800, the Eiffel Tower Supervisory Commission, chaired by our colleague Mr. Mascart, asked the Army Geographical Service to locate the summit of the tower and to verify by periodic observations whether the summit was undergoing some displacement. The solution of this problem has led to rather curious results, which seem to me worthy of mention to the Academy.
It is evident, first of all, that in the presence of such a considerable metallic mass, subject to the effects of atmospheric agents, and in particular of solar heat, one must expect to see the summit of the Tower constantly in motion; the unequal dilatation of the hips, unequally exposed to solar influences at different hours of the day, must produce, indeed, a kind of twisting of this summit, a phenomenon analogous to that which we have already noticed on the wooden pylons, serving of geodesic signals. But what is the amplitude of the oscillation and how to determine it?
The process we used is as follows:
We first founded an invariable landmark, near the foot of the vertical lightning rod, then we chose three stations outside the Tower, from which we can aim, using glasses describing a vertical plane, successively the reference and the lightning rod. In each station a portable meridian circle was installed, so that the field of the telescope included the marker and the lightning rod. With well-tuned instruments, it was thus possible, by means of the micrometer screw of the eyepiece, to measure with a high precision, at each station, the angle existing between the two planes of sight.
Beforehand, in order to have all the elements necessary for the reduction calculations, a small base was measured, the stations were connected to the reference mark by means of a triangulation, taken zenith distances; finally, one of the directions has been oriented by the observation of the Sun.
At the three stations, the observations were simultaneous and rhythmic; in each of them, the lightning rod was pointed out at agreed hours, then the marker, then the lightning rod, and so on, each series comprising four points on the lightning conductor and three on the marker; the series were spaced half an hour in half an hour. The measurements made in this way have been translated into a natural-scale scheme and referred to the fixed benchmark. The two by two intersection of the planes passing through the lightning conductor finally gives for each series a small hat, whose center of gravity provides the position of the lightning rod at the moment of the observation.
It should be noted in passing that the size of the hat makes it possible to evaluate the observation error; it follows from our operations that each position of the lightning rod is determined with an average error of ± 3 mm only. It is thanks to this precision that we have been able to study with certainty the movement of the top of the Tower, which is actually very weak, and to highlight its periodic oscillation. For each day of observation, one finally has a figurative drawing giving of half an hour half-hour the foot of the vertical of the lightning rod, and each position of the top of the Tower is defined by its horizontal distance to the fixed mark and by the true azimuth of the line joining its projection to the mark.
By bringing together the successive positions of the lightning rod, we highlight the progressive movement of the Tower during the duration of observations.
The experiments were carried out in August 1896, May and August 1897. It would have been desirable, in principle, to observe only in calm weather and covered to obtain the minimum deviation of the axis of the Tower and to conclude its location with more certainty. But this condition was difficult to achieve, as our observation posts had not been organized into permanent observatories; for a long time it would have been necessary to immobilize the numerous staff necessary for the work, who had to satisfy other imperious necessities of service. In fact, we made the observations a certain number of days, some time that he did, and the results that we found demonstrate that it is not essential to have a covered sky for the study of which it is 'acts.
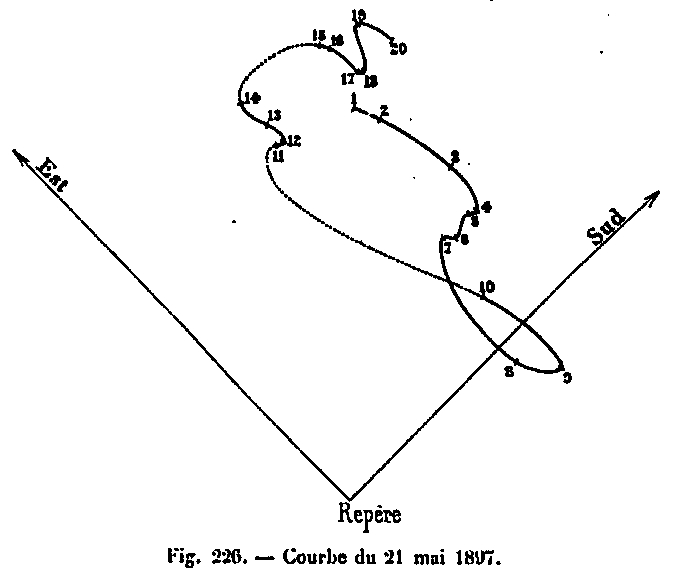
On the 21st of May and the 23rd of August, we were able to do the experiments almost continuously from the morning to the evening. We give the results below, as an example.
From the examination of the curves of these two days, it appears that the summit of the Tower has faster movements and that the variations in distance and in azimuth are more considerable in the morning than in the afternoon.
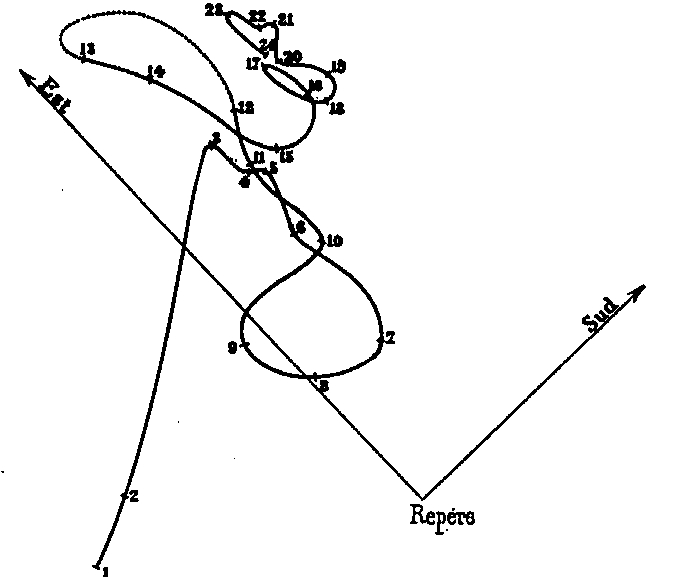
The curves of May 21 (Fig. 226) and August 23 (Fig. 227) affect a shape that is close enough to an unclosed 8. Of course the curve of the 21 hours must be more complex, and this is conceivable: towards the end of the night, the lightning rod must have weak movements; as soon as the solar heat is felt, the movements become fast; we see the lightning rod approaching the marker, then move away from it; in the afternoon, when the total effect of the heat has occurred, there is a moment of equilibrium where the movements are weak: the night comes, with the first nocturnal cooling, the movements must again be fast, then become weak again when the night balance arrives.
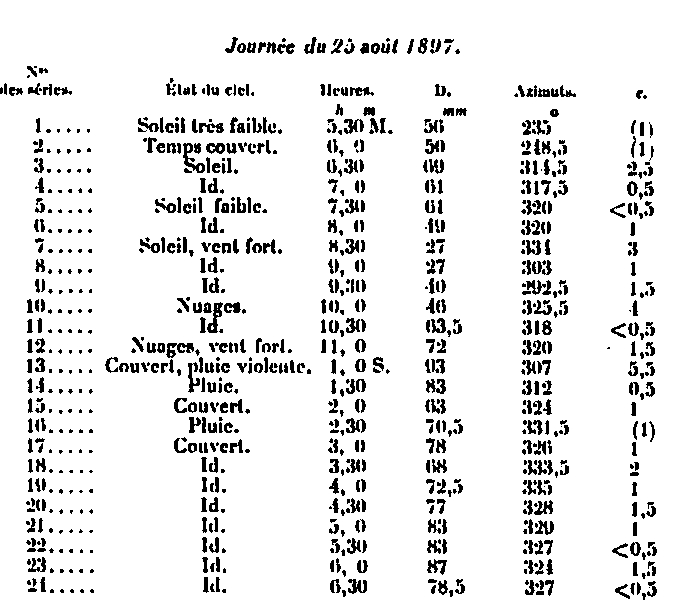
Further observations were made in August 1896 and May 1897; but these contain only a few measurements made in the morning and in the evening; they do not, therefore, have the continuity of previous days. They confirm, however, the conlcusions which we have just stated on a greater rapidity of the movements of the summit of the Tower in the morning, and on its relational fixity in the evening hours.
By condensing on the same diagram all the curves of the morning, then, on another, all the curves of the evening, one has the figures below 328 and 329.
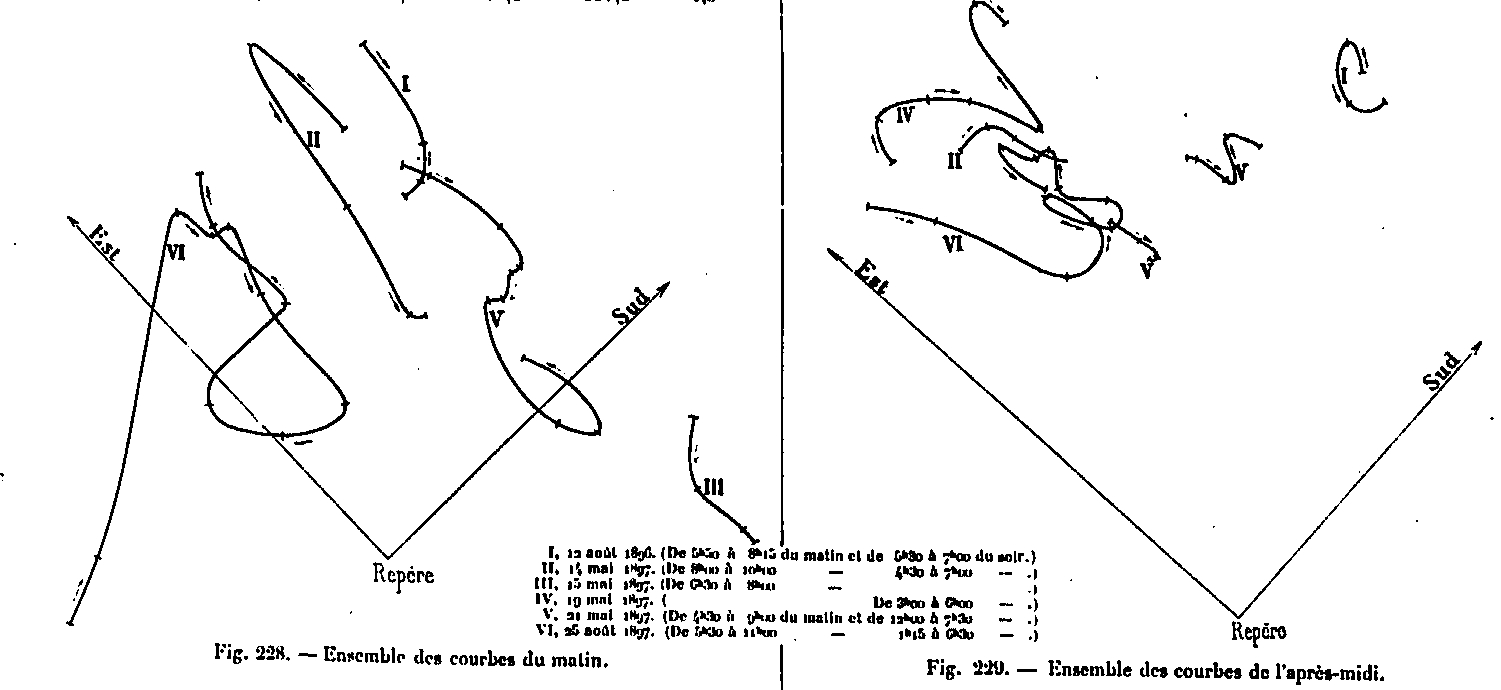
The preceding remarks lead to this conclusion that, to verify by periodic observations whether the summit of the Eiffel Tower undergoes any displacement, it suffices to make the observations during the diurnal period when the movements are the weakest, that is to say in the evening, during the two or three hours before sunset. An approximate value of the absolute position of the lightning rod with respect to the fixed reference mark will obviously be obtained, but this information will suffice to detect a significant displacement of the tower, if it has occurred in the interval between the periods of time. observation.
Speaking of this principle, we have recognized that the summit of the Tower did not undergo any appreciable displacement between the month of August 1896 and the month of August 1897: its projection is, in the evening, about 9 cm from the reference fixed soil in the South-East quadrant under a mean azimuth of 43 ° to the South.
We have also recognized, by all our observations, that the distance between the projection of the lightning rod and the fixed reference oscillated only between very small limits, from 3.7 cm to 11 cm, but that the variations in azimuth of the line joining these two points extend over more than one quadrant. The diurnal twist of the top of the tower is therefore very clearly highlighted.
If one wanted to use the Tower as a geodesic signal and make an overview, it would be necessary to adopt, as on the wooden pylons, a particular method of observation to eliminate the error from this twist.
See also: