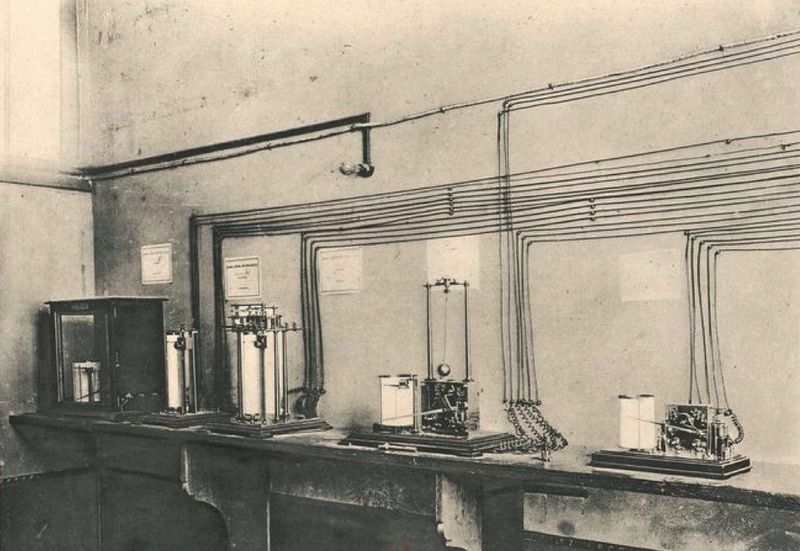
At the end of the construction of the Eiffel Tower a meteorological laboratory was installed at its summit, the interest being great to know if the observations made on the ground were in conformity with those taken with 300m of height. The results were not surprising, but interesting because they confirmed the knowledge of the time. The rest of this text is taken from the book "The Tower 300m", Gustave Eiffel , which itself takes the annals of the Central Bureau meteorological data for this data of 1890 and 1894.
Comparative meteorological observations, begun at the Central Office and on the Eiffel Tower from the completion of the Tower in mid-1889, did not become really complete until the end of the same year; they therefore now comprise five full years, a period already long enough for us to deduce some general results.
The summaries of previous observations, which cover the years 1889 and 1890, are available on the document Meteorological observations from de 1889 to 1890.
Temperatures
Diurnal variation in temperature. We give detailed tables only for the Meteorological Office (courtyard), the Saint-Maur Observatory and the Eiffel Tower, omitting the observations for the two intermediate stations of the Tower.
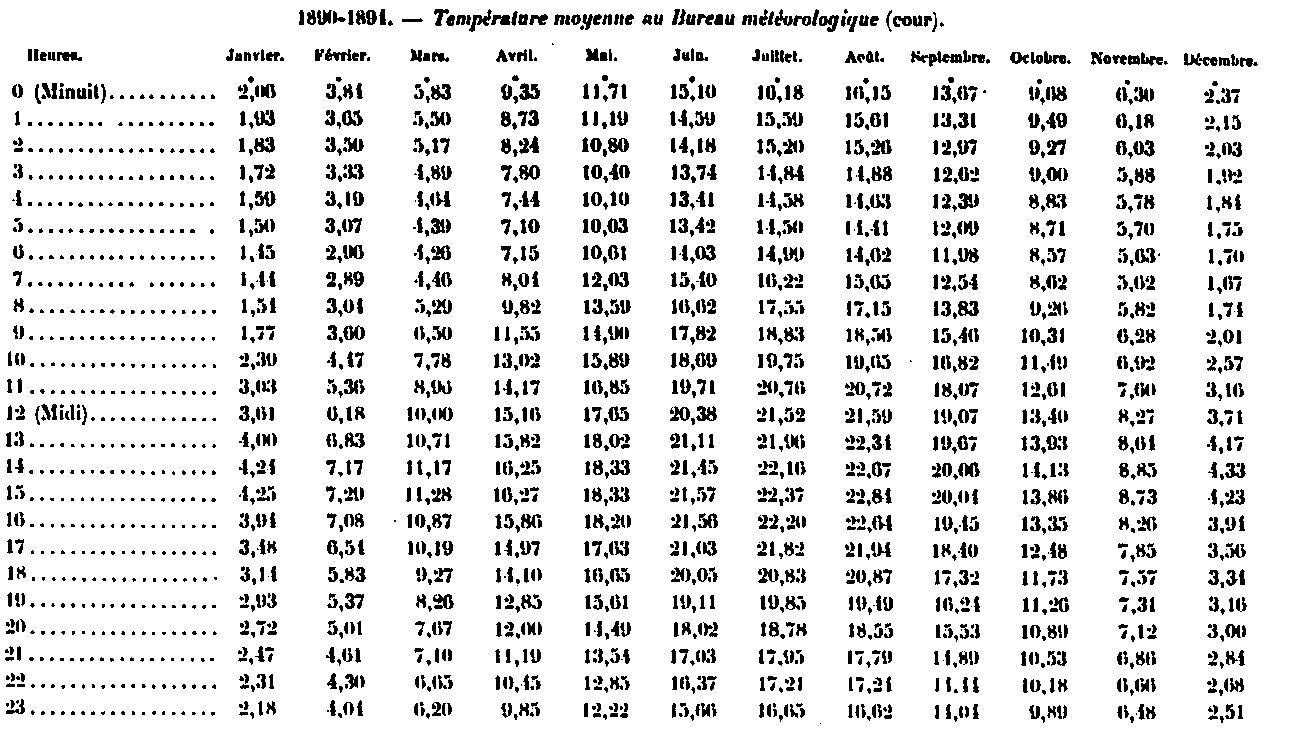
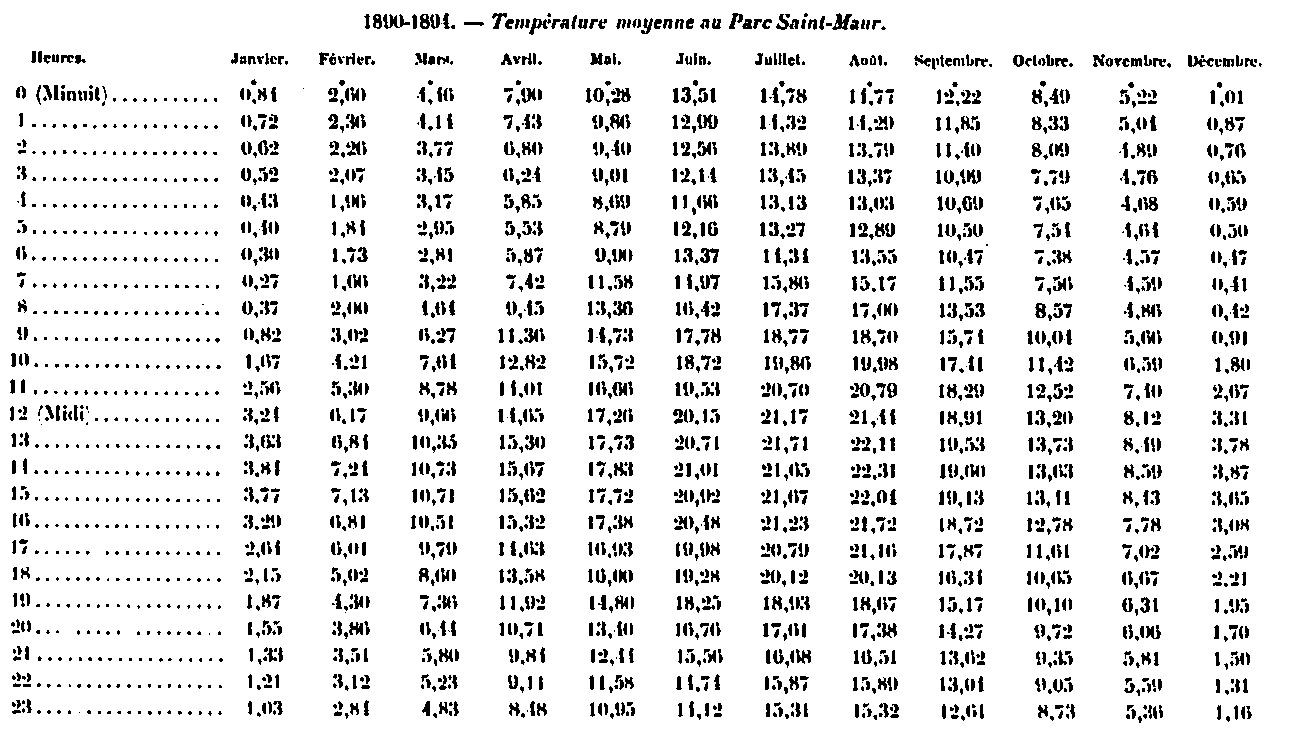
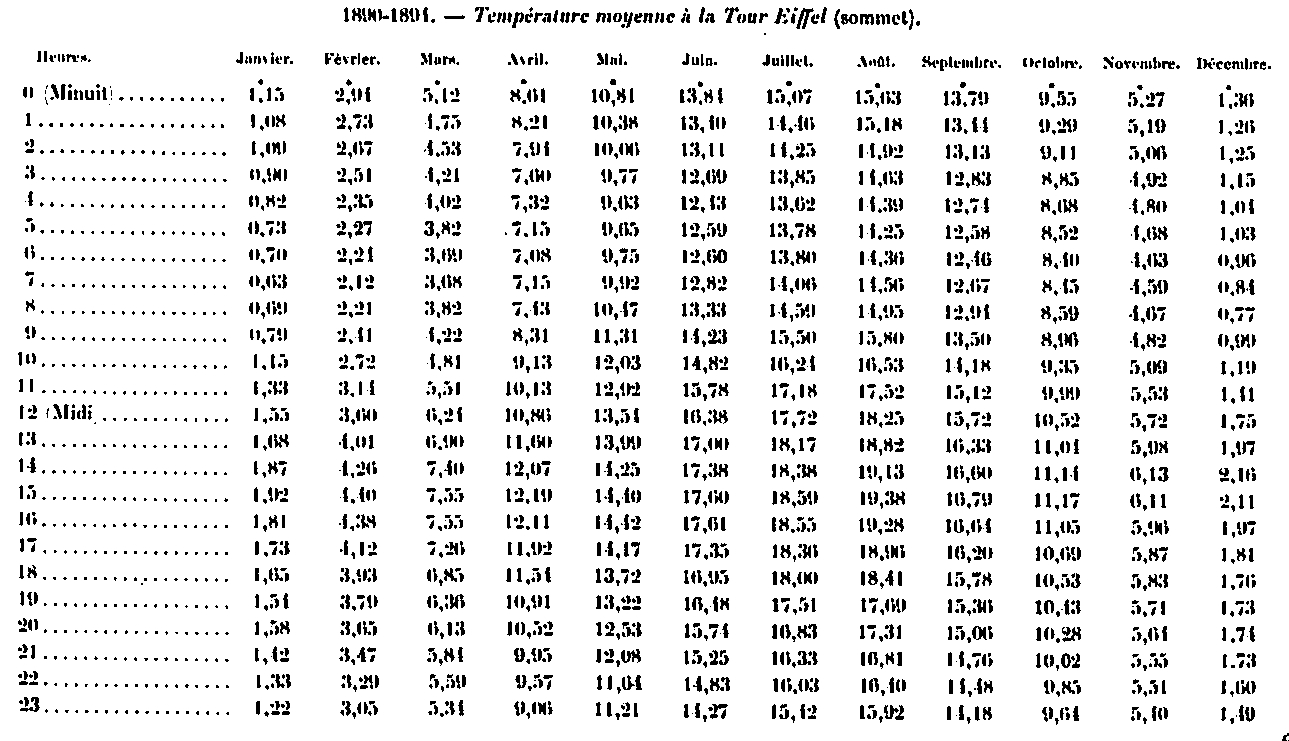
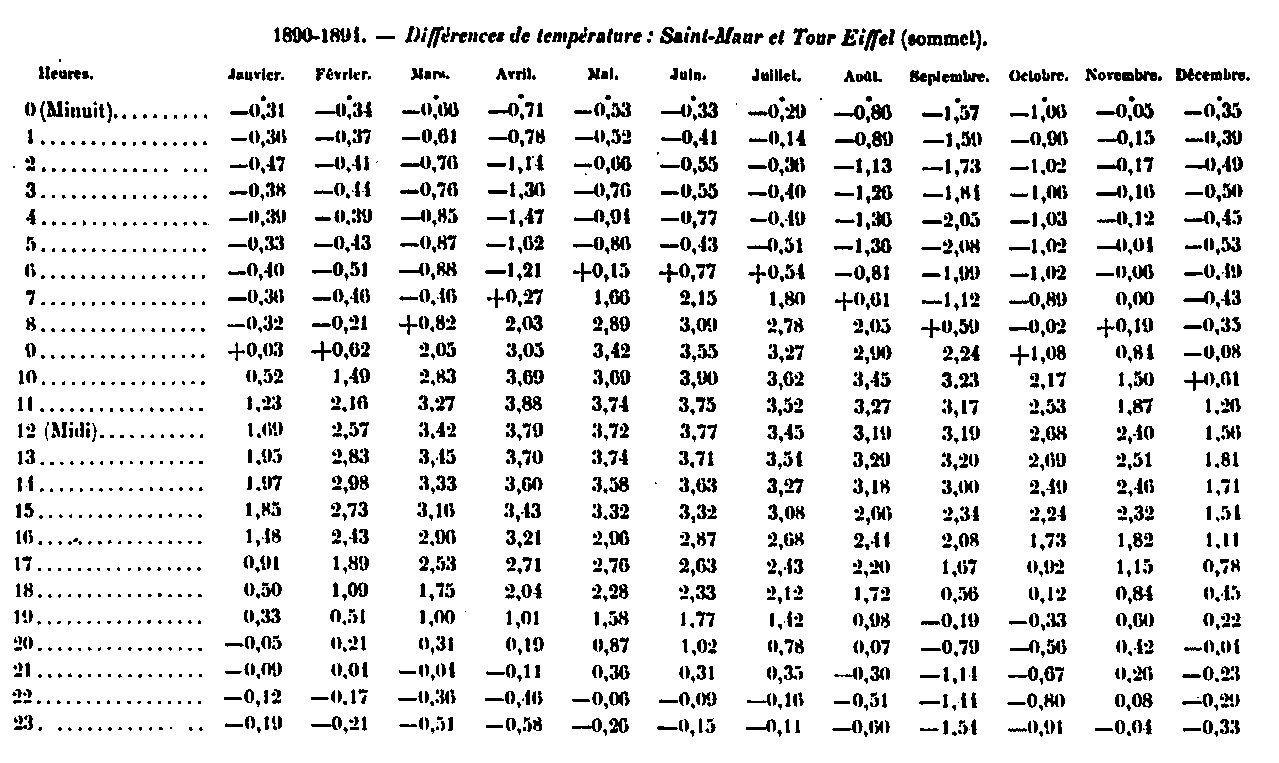
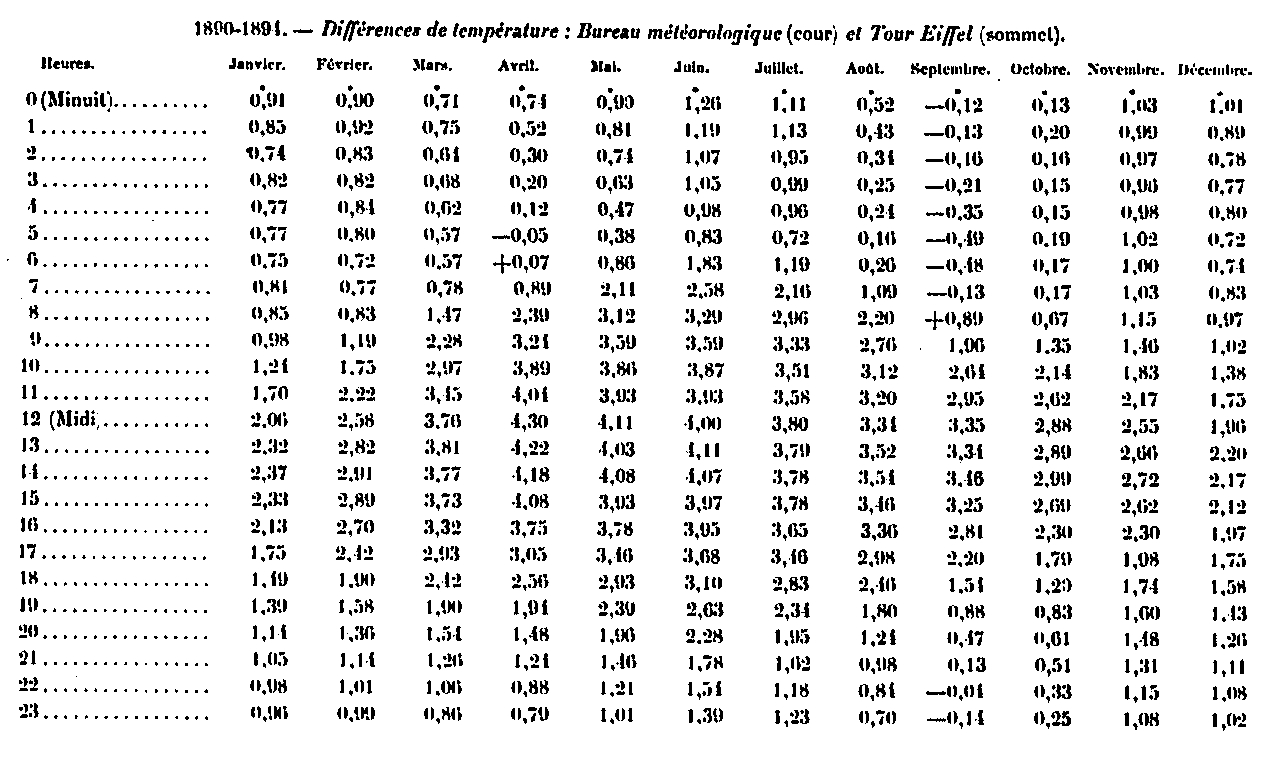
Using the numbers in the previous tables, it is easy to construct the curves that represent the diurnal variation of the temperature in the various stations and to record on these curves the values of the absolute minimum and the absolute maximum, values which differ from the remain, very few of those which correspond to the nearest hours; we thus obtain the extreme points of the figurative curve of the diurnal variation. These extremes are given below.
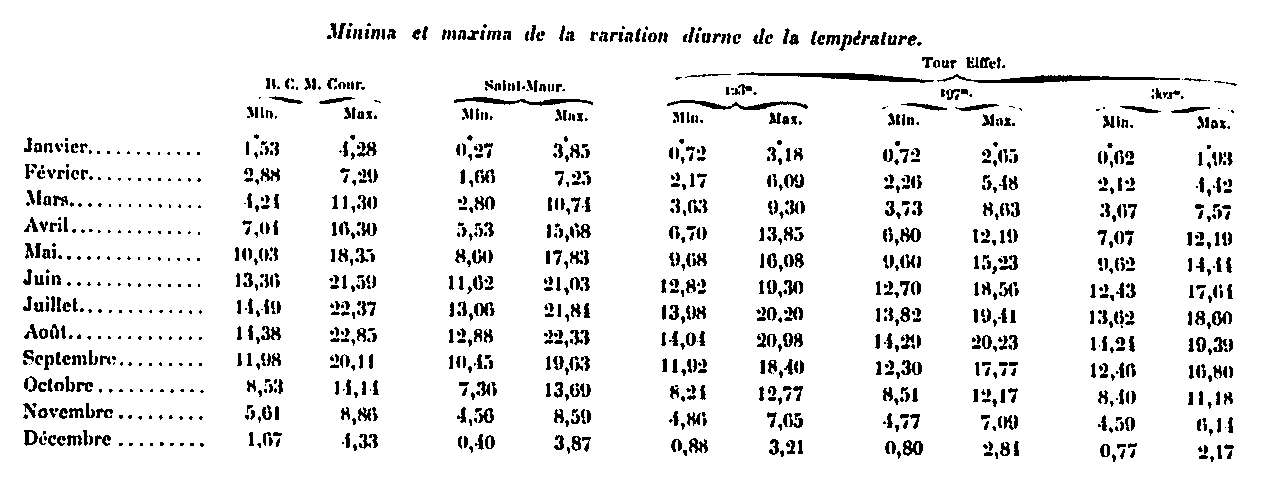
The difference between the maximum and the minimum gives, for each station, the amplitude of the periodic diurnal variation; these amplitudes are the following:

The absolute values of the amplitudes can vary a lot, for the same month, from one year to another, according to the general state of the atmosphere. They can not, therefore, be considered sufficiently well determined by only five years of observations. But the ratios of these amplitudes to those of one of the stations during the same period are certainly much less variable than the amplitudes themselves. We calculated these ratios by taking as a point of comparison the station of Saint-Maur; we give them here with only two decimals, the third obviously having no significance in the present case.

The ratio of the temperature amplitudes at Saint-Maur and in the courtyard of the Bureau of Meteorology is constant and equal to 0.90 in the eight months from March to October; it is a little weaker (0.78) in the other four months; the cause of this difference is in the particular conditions of the installation of the shelter in the Office.
At the second platform of the Eiffel Tower (123 m), the ratio of temperature amplitudes to that of Saint-Maur remains almost constant throughout the year, but shows however a slight tendency to be larger in summer than 'in winter ; this tendency is sharply accentuated at the intermediate platform (197 m), and the annual variation of the ratio becomes very important at the top (302 m).
The amplitude of the diurnal variation appears, according to the numbers reported above, to decrease according to a law faster than the altitude.
The above temperature tables contain all the information necessary to study the diurnal variation of temperature at different heights. The comparison of the numbers of Saint-Maur and those of the three stations of the Eiffel Tower shows that, in every month without exception, the inversion of temperature is the rule at night in the lowest layers of the atmosphere.

The points where the isothermal lines have a vertical tangent indicate the hours from which temperature inversion occurs in the lower layers; from these points, the temperature decreases both when we rise and when we lower; we have also represented the place of these points by two lines with broken lines. In December-January, inversion begins at ground level at 16:05: it reaches 80 m at 17 o'clock, 100 m at 18 o'clock, and rises to 125 m between midnight and 1 o'clock; then, the layer where there is inversion of temperature gradually decreases in height; it has only 100 m at 7:10 am, 50m at 9:35 am and vanishes at 10:20 am; between 10h20 and 16h05, the temperature goes constantly decreasing when we rise in the air. In August-September, the inversion begins on the ground at 4:25 pm and ends at 7:05 am, but it extends much higher in the atmosphere; there is inversion up to 200 m at 3h10m and up to more than 300 m between 6:10 and 7:05 am. The lack of observations does not allow the isotherms to be prolonged above 300 m, so that the upper limit of the inversion is not clearly determined; but, according to the general appearance of the curves, it does not seem to exceed appreciably 310m. The other periods of the year could be studied in the same way; we will confine ourselves to the two preceding ones, which seemed to us the most interesting.
Atmospheric humidity
Atmospheric moisture observations were made at the top of the Eiffel Tower, 302 m above the ground, using a Richard hair-band recorder hygrometer, the indications of which were monitored four or five times per year. week by means of those of a psychromaster placed next. Thus, directly, all instrumental corrections made, the hourly values of the relative humidity; the relative humidity and temperature combined then give the hourly values of the vapor pressure.
Diurnal variation in humidity. The hygrometric observations of the Eiffel Tower have been compared with those of Parc Saint-Maur. This comparison shows that the diurnal variation of the water vapor tension follows a completely different step at the Eiffel Tower and near the ground. In the four months of November, December, January and February, the vapor pressure is substantially constant throughout the day at the Eiffel Tower; the amplitude of the diurnal variation is indeed, especially in December and January, quite of the same order of magnitude as the probable error of averages resulting from only five years of observations. During the other months, the tension of the steam presents, in the twenty-four hours, only one maximum and one single minimum well net: the maximum occurs in the morning, towards 9 o'clock, and the minimum in the evening, towards 16 hours or 17 hours, that is to say at about the same hours as the maximum and the minimum corresponding to the ground level; but the second maximum and the second minimum observed in the evening and towards sunrise in the lower layers disappear in a nearly complete manner at 300 m of height.
As for the relative humidity, it has approximately the same value in the Parc Saint-Maur and the Eiffel Tower, in the middle of the day, at the moment of the minimum; on the contrary, in the morning, at the moment of the maximum, the humidity is much greater near the ground than at the altitude of 300 m, which is entirely in agreement with the law of variation of the temperature and the inversion that normally occurs in the lower layers.
To conclude these considerations relating to the diurnal variation of the humidity, we give below, for the two stations, the amplitude of the variation of the vapor tension and the relative humidity; these numbers were obtained simply by making the difference between the largest and the smallest hourly values given for each month in the preceding tables.

The amplitudes are much lower, in general, at 300 m than near the ground, as well for the vapor pressure as for the relative humidity; there is no exception except in March and for vapor pressure only; looking at the numbers, which are a little irregular for this month, shows that this exception would disappear in a longer observation period.
Annual change in humidity. We give below, for the two stations, the monthly averages of the vapor tension and the relative humidity, deduced from the five years 1890-1894.

The steam tension is lower in the Eiffel Tower every month than in Saint-Maur, and this is true not only for the general averages of the period, but individually for each of the five-year months. The difference between the two stations is the smallest in winter (January, 0.33 mm) and the largest in summer (July, 1.87 mm). The two extreme months are the same at the two stations, January for the minimum, August for the maximum; the differences between the average steam voltages for these two months are respectively 4.83 mm at the Eiffel Tower and 6.26 mm at Parc Saint-Maur. The amplitude of the annual variation of the vapor pressure thus decreases rapidly with altitude.
The relative humidity is also, in every month, lower at 300 m than near the ground. The difference comes exclusively from the night, as we have indicated in the study of diurnal variation. But, contrary to what we have found for the temperature and the vapor pressure, the amplitude of the annual variation of the relative humidity is roughly the same in the two stations, 23.9 in Saint-Maur, 22.8 to the Eiffel tower. The driest month is the same on both sides, April; the wettest month is November at the Tower and December at Saint-Maur; but, as the relative humidity varies very little from November to January, perhaps the wettest month would not remain the same in a longer series. Despite this analogy of walking, the difference between the two stations is far from constant: it is minimum in April (3.9) and takes considerable values at the end of the hot season: 8.2 in August, 11, 3 in October and 12.7 in September. These variations are absolutely concordant with those of temperature; it is at this moment, in fact, that the temperature difference between the two stations is the smallest, and that even the highest station may be the hottest in absolute value; since at the same time the vapor pressure is lower, the relative humidity can then become much smaller than near the ground.
Wind speed
Diurnal variation. The following tables give hourly averages of wind speed, by month, for the six-year period, 1890-1895, at the Meteorological Office and the Eiffel Tower. To facilitate the study, the values of the ratio and the difference of the speeds observed at each hour at the two stations were added.
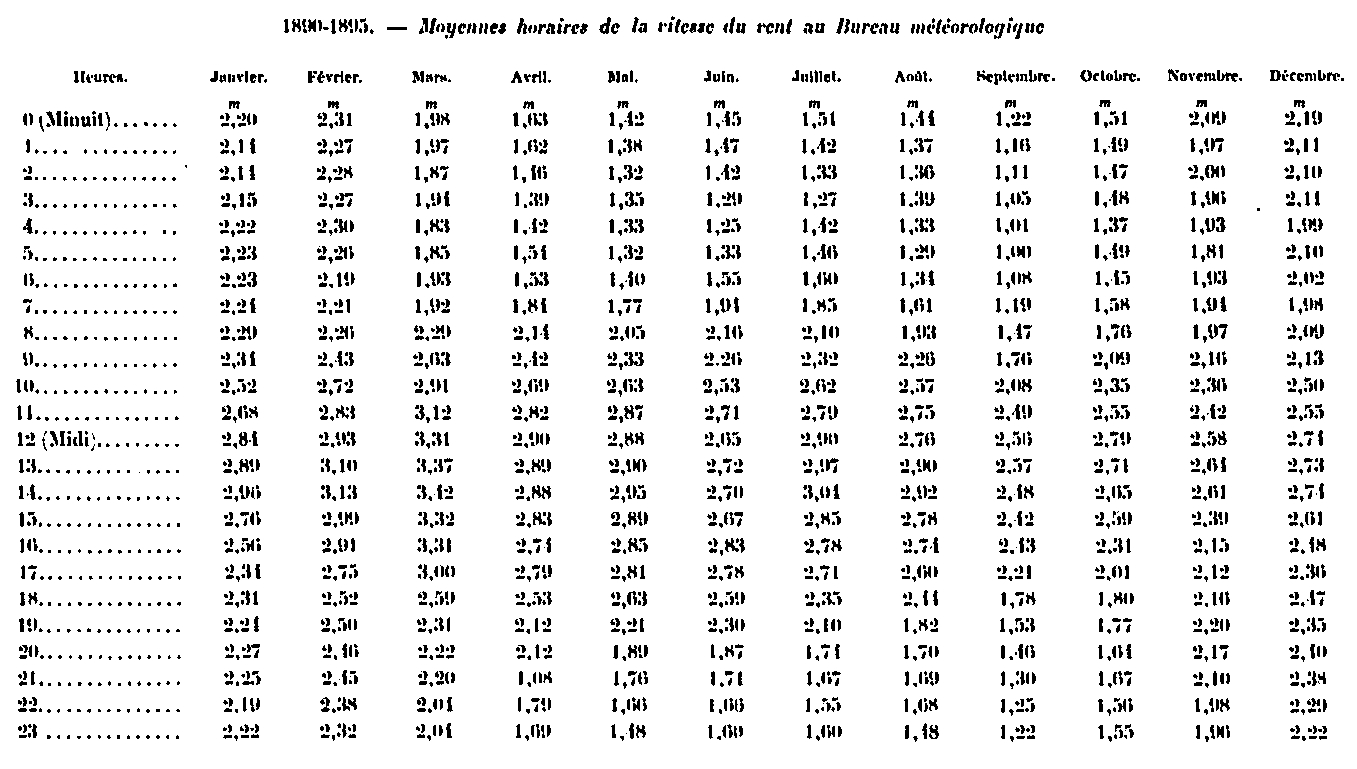
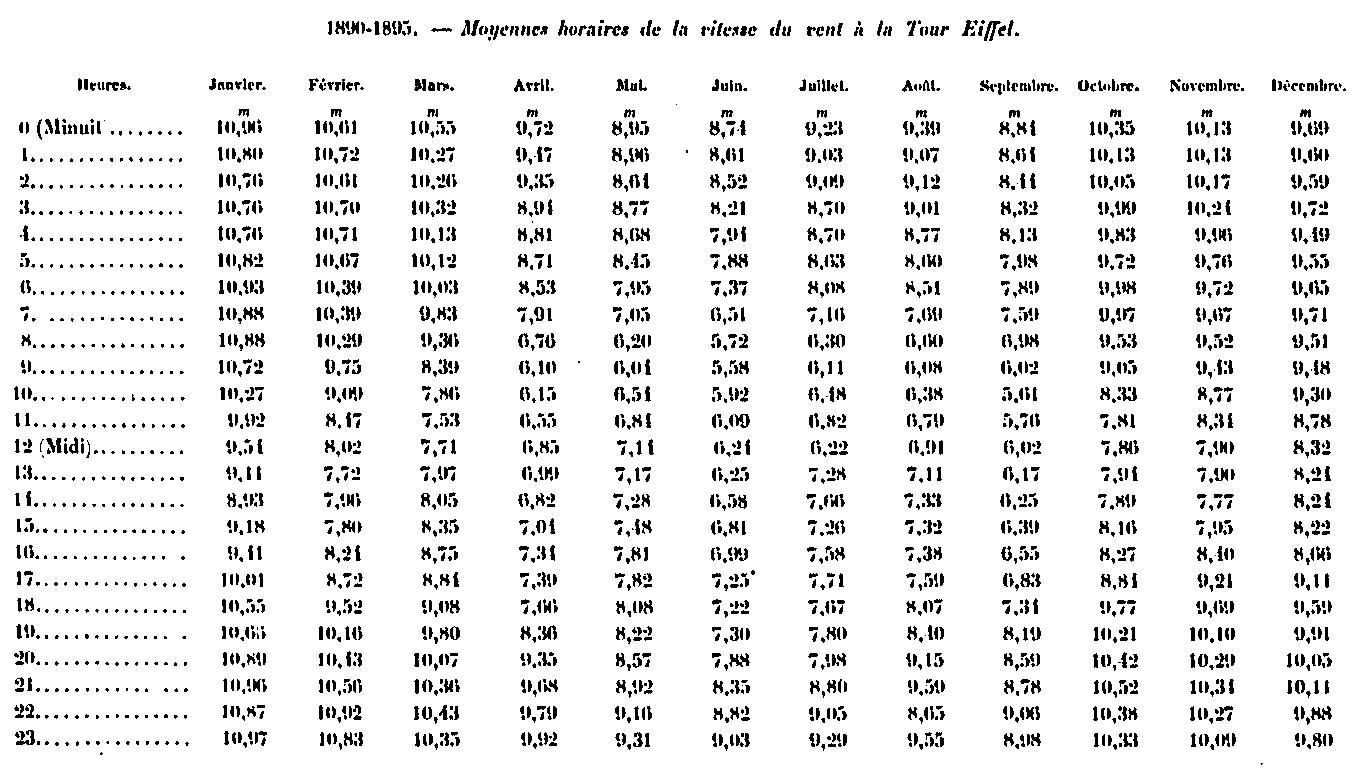
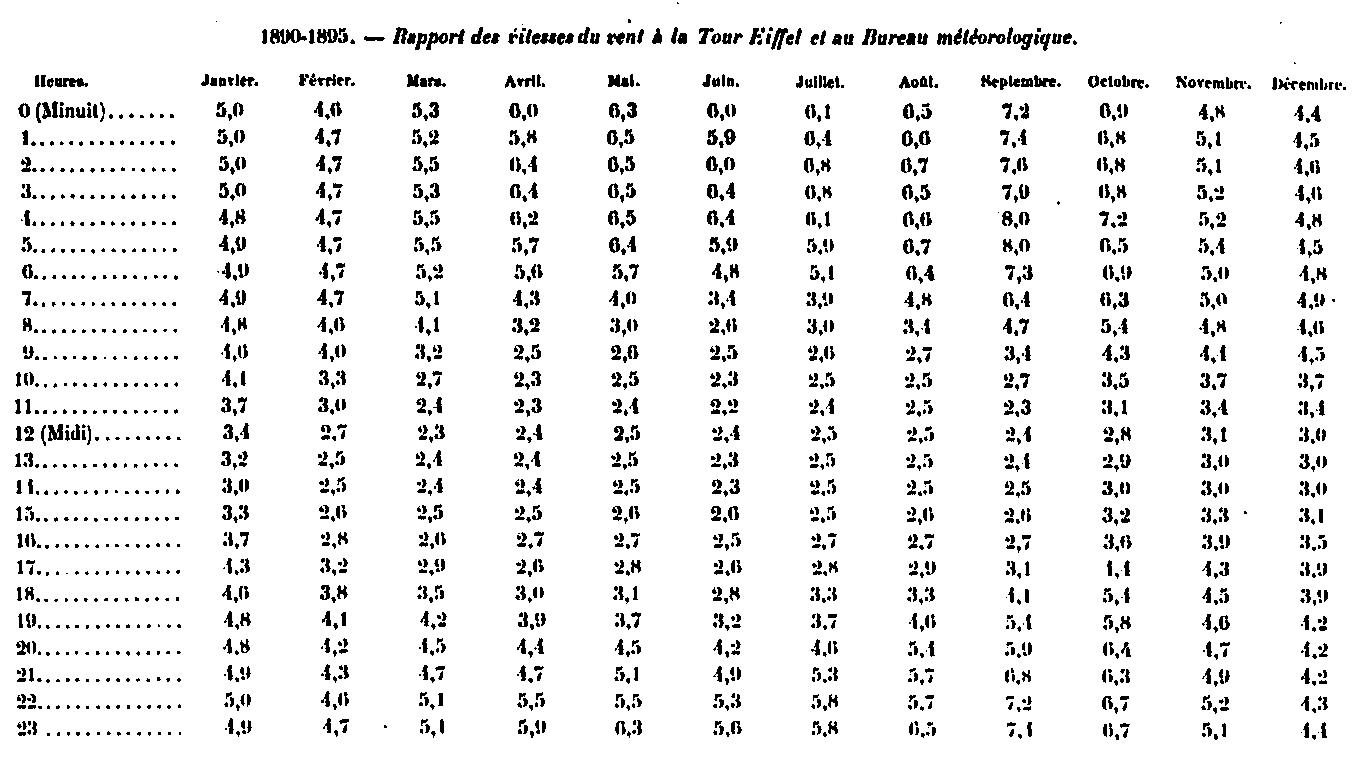
The table above gives, for every month and every hour, the report of wind speeds at the Eiffel Tower and the Meteorological Bureau. This report follows a very regular diurnal walk. The ratio of the two speeds is maximum towards the end of the night and minimum in the middle of the day. It presents the greatest variation in summer and especially in autumn. In September, in particular, this ratio varies from 2.3 (11 hours) to 8.0 (4 and 5 hours); the latter 8.0 is the highest average value of the wind speed ratio at the two stations at any one hour and in any month.
Annual variation. We give in the following tables the monthly averages of the speed in the two stations for all the months where regular observations have been made.


The annual change in the wind speed at the Weather Bureau is not very clear: there is a small minimum in August, September and October, and a maximum in February and March. This lack of regularity in the annual variation is due to the fact that, as a result of local disturbances produced by solar action, the mean wind speed is abnormally increased during the hot season in the middle of the day. In this way, the monthly average is too high because of accidental causes that have nothing to do with the general circulation. If we consider, instead of the average of the month, the average corresponding to the only night, at which time these local swirls do not exist, we find that the wind speed is, on the contrary, much greater in winter only in summer, which is in agreement with the known laws of the general circulation. The average wind speed at the meteorological office, from midnight to 4 am, has, in effect, the following value in the different months:

The annual variation becomes extremely clear on these numbers: there is a maximum at the end of winter (February), and a minimum at the end of summer (September), the value of the minimum being less than half of that of the maximum.
At the Eiffel Tower, where the relative importance of diurnal variation is less, the annual variation is immediately apparent from the examination of monthly averages. The minimum occurs in summer and the maximum in the middle of winter.
The average wind speed is almost exactly four times (4.05) higher at the Eiffel Tower than at the Weather Bureau; this ratio varies considerably in the course of the year; it is the smallest in June and the largest in October. It is sufficient, in Paris, to rise less than 300 m above the ground so that the average wind speed increases from 2.15 m to 8.71 m; so there is first, in the layers closest to the ground, a very rapid increase of the speed of the wind with the height. The observations made on the clouds show that this increase is then much slower. In order to determine the true law of increasing velocity with height, we must therefore take no account of the observations made very close to the ground, which belong to a layer in a very particular state, and where the velocity is artificially reduced by the friction. The speed of the clouds can be usefully compared only to those observed at heights of at least 100 m or 200 m above the ground.
Frequency of different wind speeds. In many applications, especially those concerning aeronautics, it is of great interest to know the degree of frequency of the different wind speeds; the observations made in the immediate vicinity of the ground would, in this respect, be very misleading, because the comparative observations at the Eiffel Tower and the Meteorological Bureau show that there is often a very appreciable and even strong wind at 300 m height, while it is almost calm down. We have therefore, by means of observations made during the six years 1890-1895, calculated the frequency of the different wind speeds at 300 m above the ground. The results of this counting are shown in the following tables:
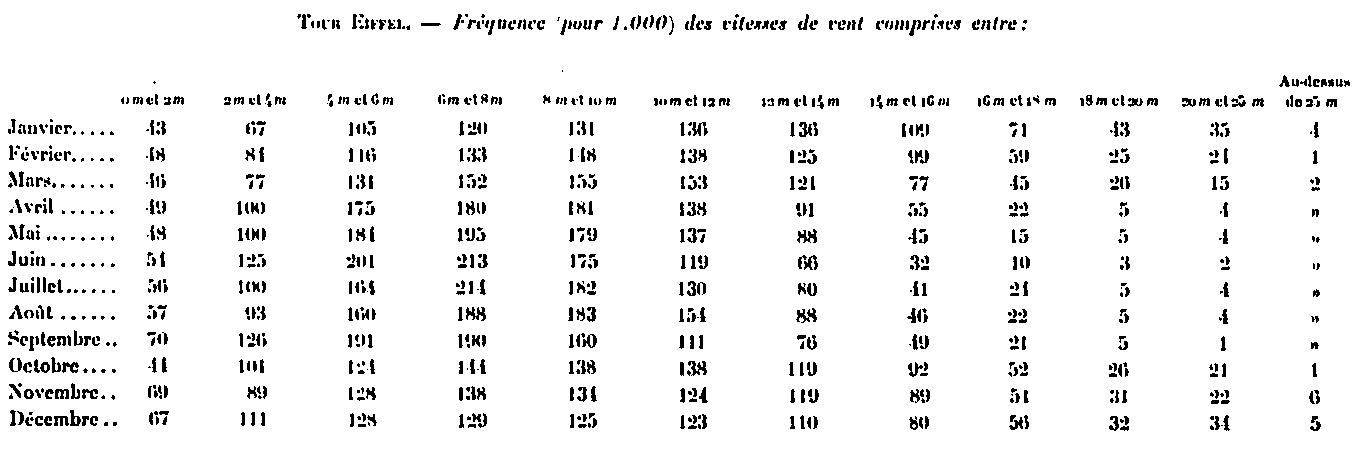

The first table gives the relative frequency, for 1000 observations, velocities between 0 m and 2 m, 2 m and 4 m, etc. ; the second indicates how, out of a total of 1,000 observations, there are some that give speeds greater than 2 m, 4 m, 6 m, and so on. These two tables, which are deduced from each other, may be useful to consult in many cases for applications.
The frequency of strong winds, greater than 10 m per second, is highest in January; it declines steadily until June, when it is minimum, increases in July and August, then, after decreasing slightly in September, increases again until the end of the year.
Storm winds, exceeding 25 m per second, are relatively rare; they are observed on average only 19 times out of 1,000 and exclusively in the six months from October to March. But it is important to notice that all these velocities have been determined by means of the ordinary anemo-cinemograph of MM. Richard brothers, who sends the recorder a contact whenever the wind has traveled a path of 25 m. This instrument does not give rigorously speed in meters per second at a given moment, but only an average corresponding to a time interval of a few minutes. In addition, all previous numbers were obtained on the counting of the wind speeds recorded at each exact time, regardless of what occurred in the intervening periods. It is clear that the proportion of very strong winds would be considerably increased, on the one hand, if an instrument with instantaneous indications had been employed, and on the other if, instead of taking the speed of the wind at each hour round, the highest speeds noted in the range of observation hours were noted.
In order to complete the storm wind data, we indicate here, for each month, the number of days at which the wind at any one time exceeded 20 m and 25 m per second, respectively. six years considered includes in all 186 days in each month of 31 days, 180 days in the months of 30 days and 169 days in February.


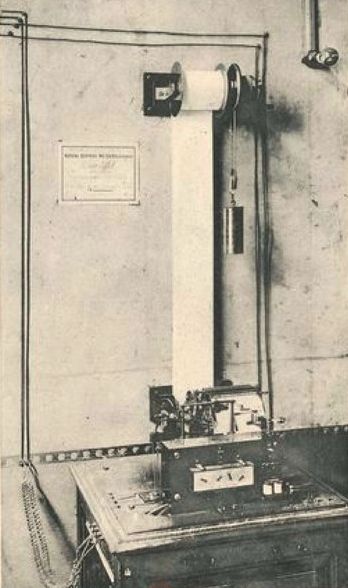
These numbers would be a little higher if they had been read on an instrument giving instant indications. An absolute speed anemo-cinemograph is in regular service at the Eiffel Tower; it sends a contact to the recording apparatus for every meter of wind, and the indications are written on a strip of paper that runs at a rate of 0.5 mm per second. Unfortunately, this delicate instrument has never been able to function continuously during storms of any duration. The highest speed recorded so far is 48 meters, November 12, 1894, at 18:13, while the standard speed recorder indicated a speed of 42 meters as an average of a few minutes. At this point, the instant indication filmograph stopped working regularly, sending his contacts only intermittently. A few minutes later, at 18:18, there was an interval of 2 ', 2 during the chronograph, during which the wind traveled exactly 100 m, which during this interval made an average speed of 45.5 m per second; it seems likely that the instantaneous speed of the gusts of wind then reached and exceeded perhaps 50 m per second.
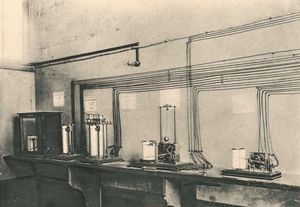
Meteorological Series
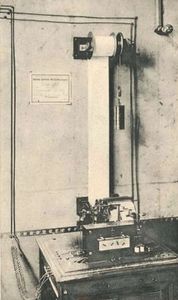
Instant Cinematographer
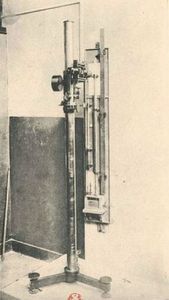
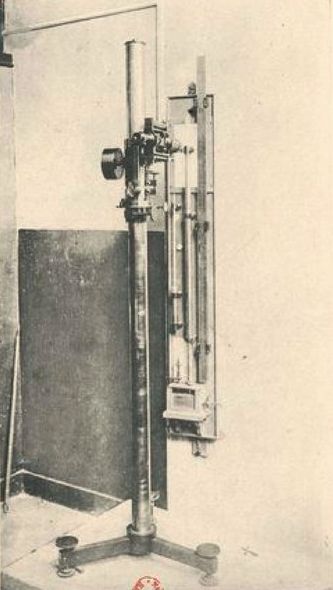
Barometer Tonnelot
Wind direction
The direction of the wind at the Eiffel Tower is recorded by means of a Richard wind vane, electric transmission, which operates in successive steps each corresponding to 1/128e circumference; the lack of transmission of a contact introduces therefore a constant error of this order in the recording. To avoid and correct these errors, which can accumulate in the long run, the true direction of the wind is raised, at the top of the Tower, at the time of the direct observations; moreover, the orientation of the wind vane is pointed very frequently by means of a telescope, from the meteorological bureau itself; lastly, the stripping was done only with an approximation four times smaller than that of which the instrument is theoretically susceptible; the circumference was divided into 32 parts starting from the North to the East, so that in all that follows the figure 32 corresponds to North, 1 to North-East, 2 to NNE, 4 to NE, 8 to East, 16 to South, 24 to West, and so on. We will first study in the following the diurnal variation of the wind at the Eiffel Tower; we found it unnecessary to go into the same details for the Bureau's observations, where the direction of the wind could be influenced by the surrounding obstacles. At the Tower, on the other hand, where the wind vane is about 300 m above the ground, the horizon is absolutely free on all sides.
Daytime variation of the wind at the Eiffel Tower. We first noted the number of times the wind blew in each direction (from 1 to 32) in all months and at all hours of the six years observed. This gives for each hour a total of 186 observations in the months of 31 days, 180 in the months of 30 days and 169 in February. This number being certainly too small for the disturbances to be eliminated, we have collected in a single total the directions observed at three consecutive hours, which gives the law of variation of the direction of the wind, for eight equidistant epochs separated the one from the other by an interval of three hours. Thus, in the following tables, the numbers which indicate the frequency of the different wind directions at zero are the sum of the numbers obtained for 23 hours, 0 hours and 1 hour; the numbers given for 3 hours are the sum of those obtained at 2 hours, 3 hours and 4 hours, and so on. The total of the numbers relative to an hour appearing on the table is thus 558, 540 and 507, according to whether we consider the months of thirty-one and thirty days, or the month of February. The total number of observations for each month is then 4,464, 4,320 and 4,056 respectively.
In the tables given by Mr. Angot, which we can not reproduce because of their extent, we find the details of the wind direction observations collected at the Eiffel Tower during the six years 1890-1895. We only use the July results as examples:

To facilitate the study of the diurnal variation of the wind direction, it is convenient to replace each of its 32 directions by their components on the N. and E., S. and O. directions; these directions will bring themselves back to the two principal N. and E. taking into account the signs.
Let mp be the number of times that the wind has blown from the direction p designated in numbers in the previous tables and which corresponds to an angle & alpha; = p / 32 with the meridian counted from north to east. The North component n of all the winds will be given by the formula n = & Sigma; mp cos & alpha; - p / 32 by summing all similar products for all winds with a direction between 0 and 8 and between 24 and 32.
The East component e - & Sigma; mp sin & alpha; - p / 32 by summing products from 0 to 16.
We calculate in a similar way the South component S. (directions between 8 and 24) and the West component W. (directions between 16 and 32).
The cosines are equal to the sines of symmetrical points with respect to 45 °; thus, sin 2-3 / 21 = cos 2-5 / 32; so that one has to consider only the numerical values of the cosine of 0 to 7 divisions, ie 0.9808, 0.9239, 0.8315, 0.7071, 0.5556, 0.3827 and 0, 1951.
As for the principal components following the meridian and the perpendicular, they are:
N = n — s E = c - o
the sign + indicates that the principal components are respectively directed north or east and the sign - that they are directed towards the South or the West.
The direction of the wind relative to the meridian, the angle & alpha; being counted from 0 to 360 °, is given by the formula Tg = E / N. The magnitude R of this resultant is R = & radic; N2 + E2.
This last number, divided by the number of observations of the month, will give the relative value of the resultant. This relative value would be equal to unity, if the wind had blown rigorously from the same direction during all the words; it is actually much smaller and more so because the direction of the wind has been more variable. We give below, for the month of July taken as an example, the values of these components and finally, for each hour, the average direction of the resulting wind, counted from 0 to 360 °, from the North to the East.

The numbers in this last table already show quite clearly a diurnal variation of the wind direction: in almost every month without exception, the wind turns counterclockwise (from west to south) in the morning and then back in the afternoon.
The study of the components themselves is done by the following considerations:
The direction of the wind that we observe at any time can be considered as the result of two actions:
- the average wind that would blow from the same direction throughout the day;
- a diurnal breeze that changes direction according to the hours.
The average wind is known: its components in the four main directions are precisely indicated in the previous table under the heading Mean. To have at each hour the components of the day breeze, it will suffice to deduct, from the numbers given above for this hour, the corresponding number found in the Average column. We give here the result of this calculation for the two principal components of the wind, in the meridian and in the perpendicular direction:
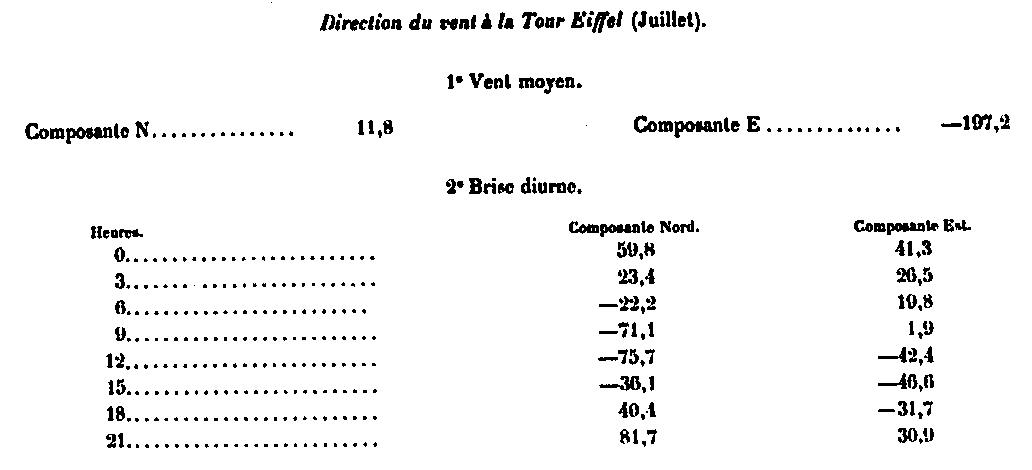
Not only in this month, but in all those from March to October, figures similar to those above show a clear diurnal variation (which is less evident in the months of November to February, due to the disturbances due to storms).
The figure below (Figure 202) gives an example of this variation for the July mean. In this figure, the average direction of the wind at any time during the day is obtained by joining point O to one of the points marked: 0 hours, 3 hours, 6 hours, ... 21 hours. These last points are distributed on a very regular curve thus traced:
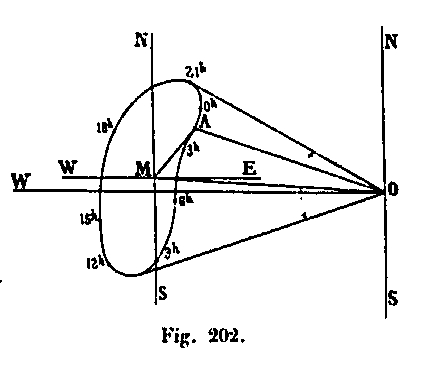
The average wind direction M O, determined using the components N. and E. taken as ordinate and as abscissa; then by taking from M, as origin, the above values of the components of the day breeze. This direction is in the present case substantially NW O. The wind AO at any time can be considered as the result of the average wind MO and a diurnal breeze MA. The figure shows that in daylight this diurnal breeze describes, in a direct clockwise direction, a complete rotation around the point M.
The day breeze has a southern component of 5 hours to 16 hours, and a North component the rest of the day. As for the wind itself, it is moving counter-clockwise from 9:00 pm to 10:00 am in the morning. in the SW approximately, and retrograde from 10 am to 9 pm from SW. in NE.
(The curve described by the MA vector is less regular in the other seasons, but generally retains the same character, at least for eight months of the year.)
If, instead of considering the frequencies of the wind, we consider velocities, the tables drawn up by Mr. Angot show that we arrive at the same conclusions. There is still a clear diurnal breeze, which in the course of the twenty-four hours rotates from N. to E. But moreover this diurnal breeze is more intense in summer than in winter; moreover, the variation of the resulting velocity R of N. and E. in summer is quite characteristic: an absolute minimum is observed towards the sunrise at the time of the maximum of the temperature, and another lower minimum towards 15 hours, at the time of maximum temperature; two maxima appear between 9 o'clock and noon and around 9 o'clock in the evening. It is likely that these interesting facts will come out in a clearer and more precise way when the observation period is longer.
Annual change in wind direction. The following tables summarize the observations made at both the Meteorological Office and the Eiffel Tower during the six years 1890-1895. Mr. Angot gives for the year the wind in each of the 32 directions, North, East, South and West, and finally the Two main components along the meridian N. and the perpendicular E. We report to abbreviate observations reported to eight directions only.
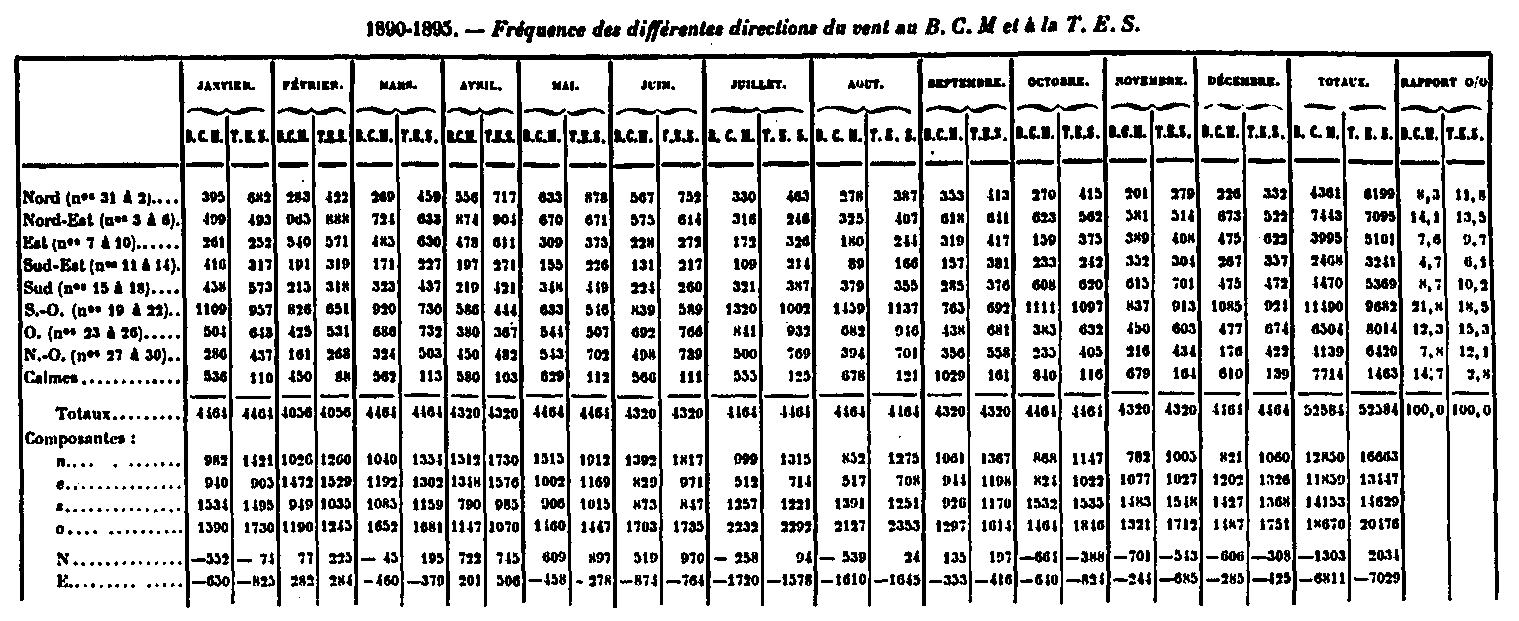
It results first of all from the 52,584 observations of this table made simultaneously at the terrace of the Central Office and at the top of the Tower, that the examination of the columns of reports for 100 shows:
- That the number of calm is much greater at the Central Meteorological Office than at the Tower (14.7% instead of 2.8%).
- That the most frequent wind at the Central Meteorological Bureau and at the Tower is the SW. (21.8% at the Central Meteorological Office and 18.5% at the Tower).
- That the least frequent wind at the Central Meteorological Office and at the Tower is the SE. (4.7% at the Central Meteorological Office and 6.1% at the Tower).
- That the north wind (between 0 and 6 on the other hand, 27 to 31 on the other) is more frequent at the top of the Tower than at the Bureau (37.4% against 30.2%).
- That the westerly winds (between 19 and 26) are about equal in importance at the Central Meteorological Office and the Tower (34.11% and 33.8%).
These are more easily felt on the surface of the soil than the northern winds that stay in the higher regions.
But the comparison of the components gives more precise and even more interesting results.
By means of the two principal components N. and E. one calculates, for each month and for the year, the magnitude R beyond resultant and the angle "that it makes with the meridian by the formulas:
R = √N2 + E2, tang α = E / N
Instead of the magnitude R, it is preferable to consider the ratio r = R / p, where p is the total number of observations from which the value R is deduced; r then represents the relative weight of the resultant. This number would be equal to unity if, during the whole period under consideration, the wind had blown constantly from the same direction; it is always necessarily much smaller, but its value makes it possible to determine if the resulting wind calculated really has a meaning; it is clear that if the value of r falls, for example, below 0.1, there is no more, strictly speaking, average wind, and that the wind has blown, in fact, from all directions. We give below the values thus found for r and α.
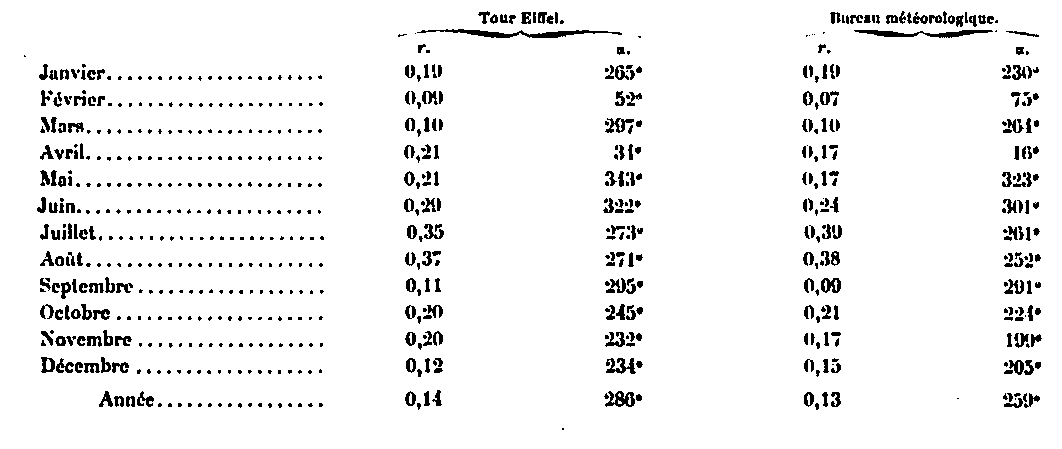
Ten months out of twelve give, in both stations, a resulting wind which has a very marked West component; February and April only have a mean wind in the NE quadrant. ; again, for February, the low value of the relative weight r of the resultant indicates that this resultant does not have much significance and that the direction of the average wind during this month is badly determined.
On a yearly average, the wind is quite close to NWT. at the Eiffel Tower and O.-S.O. at the Meteorological Bureau, the angle formed by the average directions in the two stations being 27 °. A difference of the same meaning and almost the same value is found in every month, except in February.
This difference can not be attributed to observation errors. The orientation of the two wind vanes is controlled in several directions by means of very distant landmarks (monuments of Paris) whose azimuth has been determined directly for each station; as a result, the possible error in the absolute estimate of the wind direction must not, in the averages, exceed r or 2 °. Neither can local influences be felt which would be felt at the lower station; nothing in the topographical situation of the Meteorological Bureau indicates the probability of such influences, which is excluded, moreover, by the fact that the deviation is substantially the same as the wind blows from the NE. (April), S. (November), S.-O. (January and October), from the O. (March and July), or NW (May and June).
It must therefore be admitted as a fact of observation that the wind actually experiences on average at the top of the Eiffel Tower a deviation of about 2 ° to the right of the one observed in the layers near the ground. The direction of this deviation is precisely that which would result from a diminution in the friction; but it can not yet be said that this is the sole or even the main cause of the phenomenon. Perhaps there is simply an effect of the city that, as we have indicated since the first year of observations, results in a local increase in temperature and a decrease in pressure that can lead to a deviation of the winds lower.
Resume
It appears from the discussion of the observations on the direction of the wind by Mr. A. Angot that:
- As a diurnal variation, the wind turns counter-clockwise (from west to south) in the morning, then returns in the opposite direction in the afternoon;
- As an annual average, the wind is quite close to NW-O at the Eiffel Tower, and from O.-S.-O to the Meteorological Bureau, the angle formed by the average directions at the two stations being 27 °
These results are new and of great interest.
Vertical component of the wind
Mr. Angot has not yet summarized the results for this vertical component; we must look for them in the Memoirs of 1891 to 1894, which we will briefly recall; we will mainly reproduce the conclusions that are identical in all the years.
The study of vertical currents is of great interest for meteorology, and such observations have not yet been made in such a satisfactory situation as at the Eiffel Tower; so M. Angot gives on this subject the most detailed tables, of which we will recall only a small part, leaving aside the years 1892 to 1893 whose results are not very different from the extreme years.
Memory of 1897. The vertical component of the wind was measured by means of a device similar to those already employed for this purpose by P. Dechevrens and M. Garrigou-Lagrange. This instrument is composed of four flat fins, inclined at 45 "and carried by four horizontal cross arms, joined by a vertical axis, around which the system can rotate, the fins being inclined in the same direction relative to the axis, it is clear that the reel must remain motionless in a horizontal air current, turn in one direction when the wind has an ascending vertical component and in the other direction when the wind has a descending horizontal component. very ingenious, imagined by Richard Brothers, and which is identical to that of their wind vane, the movements of the reel are transmitted at a distance, by means of only four threads, to a vertical cylinder, in front of a generator from which a feather descends, which marks all the movements of the reel.The course is from left to right when the component of the wind is ascending, from right to left when the component is descending; t at a vertical line when the reel remains stationary. The reel has been calibrated on a ride so that the angular displacement of the receiving roll, for a given time, can be translated immediately in kilometers traveled by the wind in the vertical direction. The reel is installed at the top of the Eiffel Tower, at the same height as the anemometers (305 m above the ground).
The observation of this instrument presents great difficulties; it can rotate even in a perfectly horizontal current if the speed of the wind is not rigorously the same at both ends of the diameter of the reel, and for that it is sufficient for the smallest obstacle. The first observations, made in 1889 and at the beginning of 1890, revealed a cause of error of this kind: the rod which carries the lightning rod of the Eiffel Tower could make screen sometimes on one side of the reel, sometimes on the other when the wind was blowing from two directions; for one of these directions, there was apparent strengthening of the upwinds, while for the other, there was apparent strengthening of downward winds.
I have remedied this error by placing the reel in the center of a large vertical cylinder open at both ends. There is much to be feared by the eddies which the wind can produce in this cylinder; but there is no reason for these disturbances to introduce a systematic error; indeed, careful examination of the observations revealed no such error. Be that as it may, the observations of the vertical component of the wind can only be given with great reserve, and the method of observation should be improved, if possible.
In the following table we indicate for each month the number of hours during which the vertical component of the wind has been constantly ascending, sometimes ascending and descending (variable), constantly descending and constantly nil; then the total of the paths covered respectively by the ascending winds, the descending winds, and the ratio of these two numbers. Finally, in order to assess the relative importance of the updrafts, we added for each month the average speed, in meters per second, of the vertical component of the wind, and beside the average speed of the horizontal component, measured by the Richard reel; the ratio of these two numbers is the cotangent of the inclination of the wind on the horizontal; we give this ratio as well as the corresponding inclination, expressed in degrees and tenths of a degree.
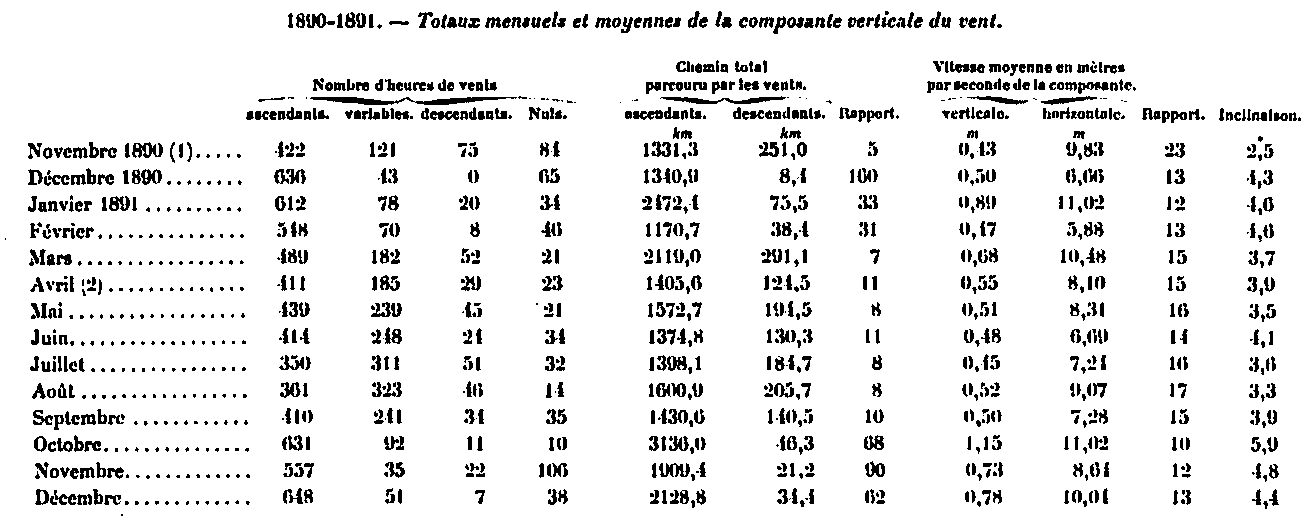
The examination of the preceding tables leads to the following conclusions:
1. In all months without exception, upwind winds greatly outweigh the downwinds. The ratio of the total paths traveled by the wind in these two directions varies little in the months between March and September; it is then on average 8.6. In the cold months (November 1800 except for the observations, the ratio is much greater, it is on average 54.2 and even reaches 160 in December 1890. It seems difficult to explain this preponderance of the ascending winds: we do not can be attributed to the temperature, since it is exaggerated in winter.This can not be either a local effect caused by the undulations of the ground, since the Eiffel Tower dominates much the whole area, to find comparable altitudes, It should be added that this preponderance is manifested by all the wind directions, which excludes the hypothesis of an influence of the orientation of the instrument with respect to the direction of the instrument. As long as it can not be proved that this preponderance of ascending winds is due to a defect inherent in the very mode of observation, it must be admitted, however paradoxical it may be. e appear.
2. The periods during which the vertical component of the wind is constantly descending or nil occur mainly during the night; they are sometimes found during the day, but in winter, and never in the hot season. The duration of these periods does not exceed a few hours, except in winter, by calm times.
3. The periods during which there is alternating ascending and descending winds are especially frequent during the hot season, from March to September, in the middle of the day; they are even then the rule. Upward winds still have a lot of success, but they are frequently interrupted by downstream currents. These alternatives are rare during the night in summer and at any time during the winter. Those which we have indicated then in one of the preceding tables come mainly from the hours during which there was change of regime, where the wind, after being descendant, became ascending, or reciprocally; they are not alternatives to ascending and descending winds proper.
4. The periods of constantly ascending wind have a very variable duration; they are especially important during the cold season, where they are sometimes observed continuously for several days, and even for more than a week.
5. The average ratio of the vertical and horizontal components of the wind is very small, that is to say that the inclination of the wind on the horizon is always small; for the fourteen months we have considered, this average inclination is 40.
Memory of 1804. We give below a table similar to that of 1891.
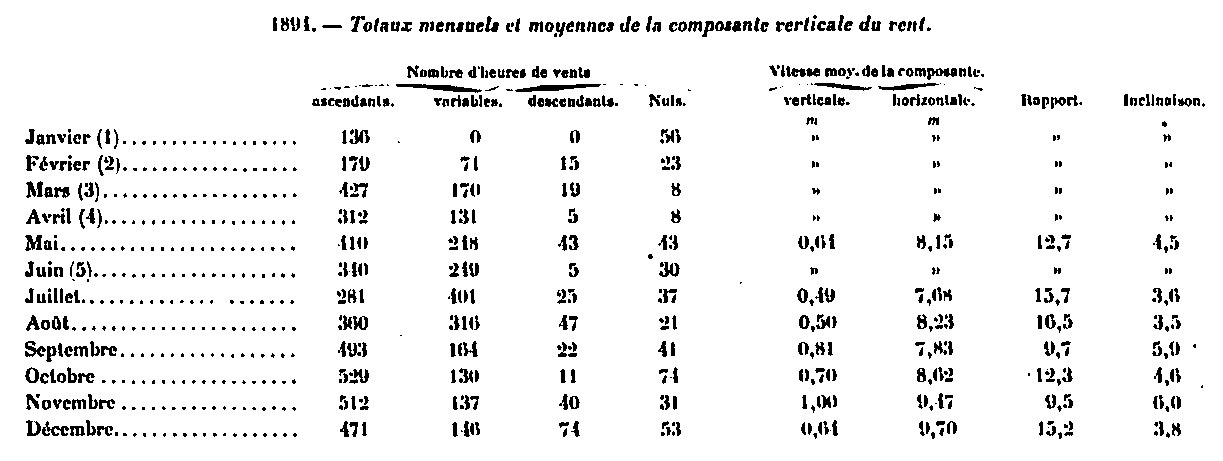
As we can see by the numbers of the last column, the average inclination of the wind on the horizontal is always very weak; it reached its highest value, 6 °, in November.
The conclusions that can be drawn from the preceding tables are identical to those provided by the discussion of previous years; it is therefore useless to insist on it, and we will refer for this point to the earlier Memoirs.
We will end with some details about the storm of November 12, 1894, which presented an extraordinary violence in Paris and throughout the north of France. The center of the depression was at the Scilly Islands at 7 o'clock; he is at Cherbourg at about six o'clock, then goes up by the Pas de Calais and the North Sea; it has thus passed about 200 km north of Paris, where the minimum barometric pressure has been observed between 5 pm and 7 pm
The following table gives, in meters per second, the average speed for each hour of the horizontal component and the vertical component at the Eiffel Tower; we have added the indication of the inclination of the wind on the horizontal and its direction.

Throughout the storm, the wind showed a vertical component directed from the bottom up. The inclination of the wind, the maximum at the moment when the center of the storm is nearest (8 °, 7), is very great still and almost the same in the anterior half of the vortex. On the contrary, it becomes very weak at a certain distance in the posterior part, where the ascending wind is then cut off by frequent alternations of descending winds, which did not occur in the anterior part. In front of the depression, the wind is clearly and constantly rising, while quite backwards it is almost exactly horizontal. The velocity of the horizontal current was, moreover, the same at the beginning and at the end, and the direction varied only by 45 °, between the moments of the largest and the smallest vertical velocities; these phenomena are therefore real and can not be attributed to the exposure mode of the instruments.
Other previously observed storms had similar results, but all of them also relate to the part of the vortex to the right of the trajectory.
See also:


